library(tidyverse)
library(lubridate)
library(gt)
library(gtExtras)
library(rvest)
Olist is an e-commerce platform based in Brazil that connect both small and medium sized businesses to customers through a single marketplace. It offers a range of features and services to help sellers grow their businesses, including free online store, integrated shipping and logistics, and access to a large customer base.
An historical analysis dating back from September 2016 to October 2018 will be performed to help us gain insight into the performance of the platform. The goal is to identify trends, patterns and relationships that can inform future decision-making and help improve overall performance.
Libraries
Importing data
The dataset contains details of more than 90K orders, it include multiple variables such as unique order id, price, payment, status, customer, sellers, review score and so more, grouped into different tables for easy storage and analysis.
The file for all the needed data for this analysis can be found on kaggle.
csv_name <- c(
  "customers",
  "order_items",
  "order_payments",
  "order_reviews",
  "orders",
  "product_category_name",
  "products",
  "sellers"
)

all_datasets <- map(
  csv_name, \(table) read_csv(glue::glue("data/olist_{table}_dataset.csv"))
)
names(all_datasets) <- csv_name


orders <- all_datasets$orders
order_items <- all_datasets$order_items
order_payment <- all_datasets$order_payments
products <- all_datasets$products
product_category_name <- all_datasets$product_category_name
customers <- all_datasets$customers
sellers <- all_datasets$sellers
reviews <- all_datasets$order_reviews

rm(all_datasets)
Helper functions
Code
clean_names <- function(data, new_names = NULL) {
  if (is.null(new_names)) {
    data |>
      dplyr::rename_with(
        \(c) stringr::str_replace_all(c, "_", " ") |> stringr::str_to_title()
      )
  } else {

    names(data) <- new_names

    return(data)
  }
}

interactive_gt <- function(table, sort = FALSE, filter = FALSE) {
  gt::opt_interactive(
    table,
    use_pagination_info = FALSE,
    use_sorting = sort,
    use_filters = filter,
    pagination_type = "simple"
  )

}

unique_sum <- function(var) {
  unq <- unique(var)

  if (length(unq) > 1) {
    sum(unq, na.rm = TRUE)

  } else {
    unq
  }
}
Code
color_line <- "#3B3B3B"
color_title <- "#5C5C5C"
color_axis_title <- "#4D4D4D"
color_highlight <- "#F7F7F7"
color_bold <- "#888888"
Data Cleaning
The product category name variable will be converted from Portuguese to English, a minor string formatting for the payment type variable. Also customer state will be transform from the two letter abbreviations to the full names and their respective regions will be added.
Code
lvls <- product_category_name$product_category_name
names(lvls) <- product_category_name$product_category_name_english

products <- products |>
  mutate(
    product_category_name = as_factor(product_category_name),
    product_category_name = fct_recode(product_category_name, !!!lvls),
    product_category_name = str_replace_all(product_category_name, "_", " ") |>
                            str_to_title()
  )

order_payment <- order_payment |>
  mutate(payment_type = str_replace(payment_type, "_", " ") |> str_to_title())
Code
page_html <- read_html("https://brazil-help.com/brazilian_states.htm")

state_name_code <- page_html %>%
  html_elements("table") %>%
  map(html_table) %>%
  .[[28]] %>%
  select(X1, X2, X4) %>%
  rename(code = X1, name = X2, region = X4) %>%
  slice(3:nrow(.)) %>%
  mutate(across(name:region, \(x) str_replace_all(x, "\\n", " "))) %>%
  mutate(region = case_when(region == "Southeast" ~ "South East",
                            region == "Northeast" ~ "North East",
                            .default = region))

name_code <- state_name_code$code
names(name_code) <- state_name_code$name

region_code <- state_name_code$code
names(region_code) <- state_name_code$region

customers <- customers |>
  mutate(customer_state_name = fct_recode(customer_state, !!!name_code),
         customer_region = fct_recode(customer_state, !!!region_code))
Analysis
In this analysis of Olist e-commerce platform, the aim is to answer several research questions using R programming language, Also various methods such as trend analysis and data visualization, will be used to explore patterns in the order data over the selected period. the result will be presented in tables and charts, providing insights into trends in sales volume and revenue as well as identifying top-selling products.
Revenue
This is the total amount of money earned by all sellers on the e-commerce platform from sales of products from September 2016 to October 2018. It is a key metric, as it reflects their capacity to generate income and grow over time.
What was the total revenue generated by Olist, and how has it changed over time?
What is the trend of Olist’s total revenue over time? Specifically, how did Olist’s revenue change from 2016 to 2018.
temp <- orders |>
  left_join(order_payment, by = "order_id") |>
  filter(!order_status %in% c("canceled", "unavailable"))
Total revenue generated by olist
temp |>
  summarise(total = sum(payment_value, na.rm = TRUE),
            minimum = min(payment_value, na.rm = TRUE),
            average = round(mean(payment_value, na.rm = TRUE), 2),
            maximum = max(payment_value, na.rm = TRUE)) |>
  add_column(order_purchase_year = "ALL", .before = 1) |>
  bind_rows(
    temp |>
      mutate(order_purchase_year = as.character(year(order_purchase_timestamp))) |>
      group_by(order_purchase_year) |>
      summarise(total = sum(payment_value, na.rm = TRUE),
                minimum = min(payment_value, na.rm = TRUE),
                average = round(mean(payment_value, na.rm = TRUE), 2),
                maximum = max(payment_value, na.rm = TRUE))
  ) |>

  clean_names() |>
  gt() |>
  fmt_number() |>
  tab_spanner(label = "Revenue", columns = Total:Maximum) |>
  tab_style(style = cell_fill(color = color_highlight),
            locations = cells_body(columns = Total)) |>
  tab_style(style = cell_fill(color = color_highlight),
            locations =  cells_body(rows = 1)) |>
  tab_style(style = cell_text(weight = "bold", color = "#707070"),
locations = cells_body(`Maximum`, 3))| Order Purchase Year | Revenue | |||
|---|---|---|---|---|
| Total | Minimum | Average | Maximum | |
| ALL | 15,739,137.01 | 0.00 | 153.44 | 13,664.08 |
| 2016 | 51,813.38 | 0.74 | 165.54 | 1,423.55 |
| 2017 | 7,092,491.65 | 0.00 | 151.74 | 13,664.08 |
| 2018 | 8,594,831.98 | 0.00 | 154.81 | 7,274.88 |
According to the analysis on revenue data of Olist, a total revenue of 15,739,137 was generated during the period from September 2016 to October 2018. It is worth noting that 2018 was the year with the highest total revenue generated, even though the available dataset contained 10 months in total. On the other hand, 2016 only had 4 months and generated the lowest revenue as expected. Furthermore, the average revenue by order is 153.44, indicating a consistent revenue generation pattern in terms of order volume. The highest single revenue was generated in 2017, which is a noteworthy finding that may suggest a particular factor or event that contributed to the peak revenue in that year. Finally, we observed that the average revenue generated in 2018 is closer to the overall average revenue, implying a relatively stable revenue generation pattern. These findings provide valuable insights into the historical revenue performance of Olist.
How did it change over time.
temp |>
  mutate(order_purchase_date = date(order_purchase_timestamp)) |>
  group_by(order_purchase_date) |>
  summarise(revenue = sum(payment_value, na.rm = TRUE)) |>

  ggplot(aes(x = order_purchase_date, y = revenue)) +
  geom_line(color = color_line) +
  labs(x = "Order Purchase Date",
       y = "Revenue",
       title = "Revenue Generated (Sep 2016 - Oct 2018)") +
  scale_y_continuous(labels = scales::comma_format()) +
  theme_minimal() +
  theme(plot.title = element_text(color = color_title, size = 12),
        axis.title = element_text(color = color_axis_title, size = 9))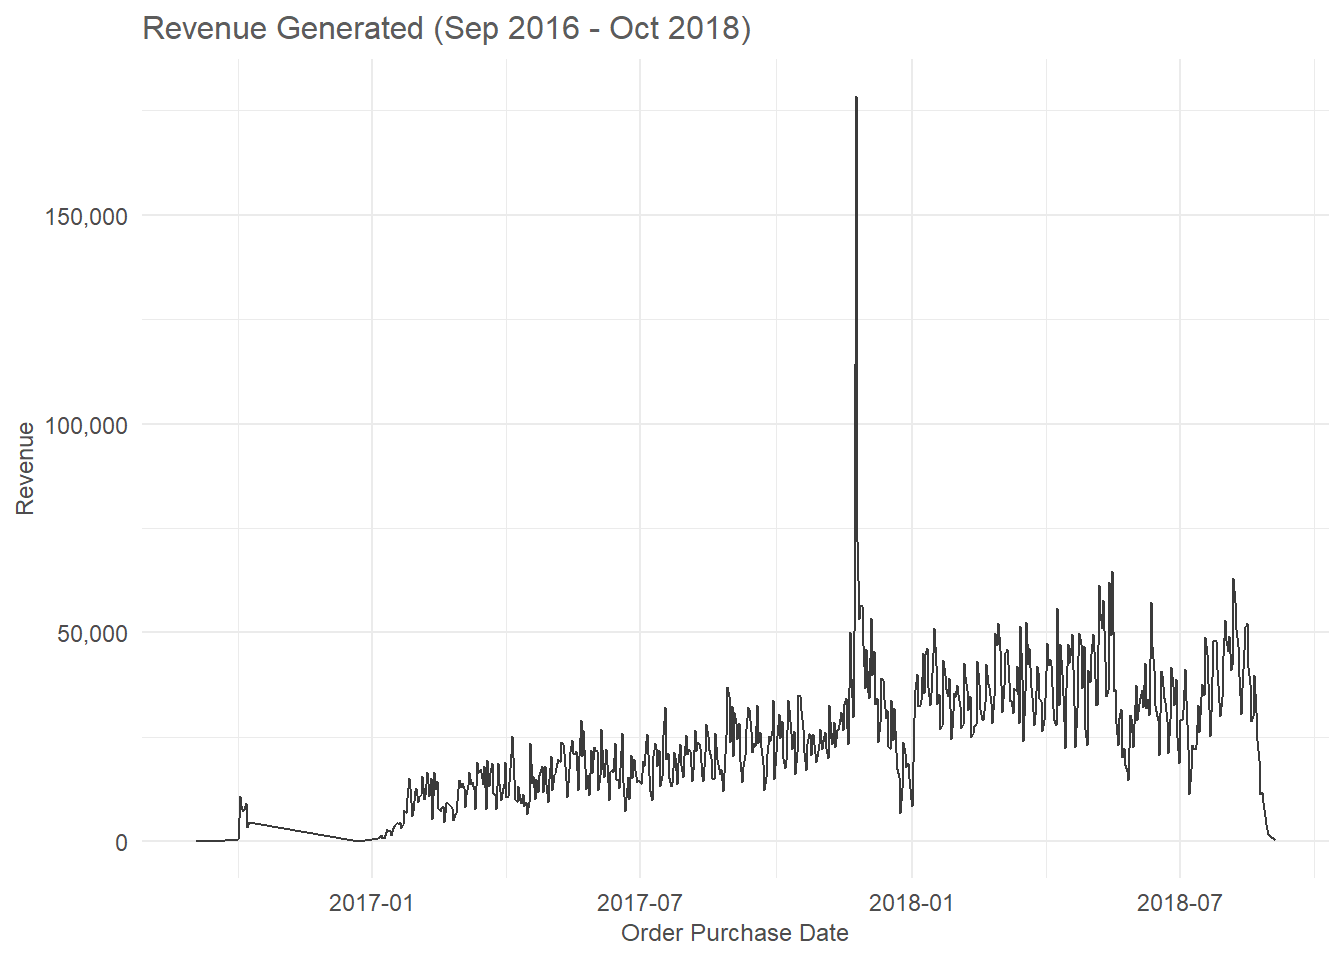
After examining the revenue trend chart for the selected years, we can see that the revenue generated by Olist was relatively low in 2016 and declined towards the end of the year. In contrast, revenue increased in the following years, with a peak in 2017. The highest amount of revenue was generated on November 24, 2017, amounting to 178,450. It is interesting to note that revenue generated over time are volatile, especially in 2018. This may suggest that certain factors, such as changes in the market or customer behavior, may have influenced revenue performance during this period. Overall, our analysis suggests that the revenue generated by Olist has shown some fluctuations.
By year
temp |>
  mutate(order_purchase_year = year(order_purchase_timestamp),
         order_purchase_date = date(order_purchase_timestamp)) |>
  group_by(order_purchase_date, order_purchase_year) |>
  summarise(revenue = sum(payment_value, na.rm = TRUE)) |>

  ggplot(aes(x = order_purchase_date, y = revenue)) +
  geom_line(color = color_line, show.legend = FALSE) +
  labs(x = NULL, y = NULL, title = "Revenue Generated by Year Period") +
  facet_wrap(vars(order_purchase_year), ncol = 1, scales = "free") +
  scale_y_continuous(labels = scales::comma_format()) +
  theme_minimal() +
  theme(plot.title = element_text(color = color_title, size = 12),
        axis.title = element_text(color = color_axis_title, size = 9),
        axis.text = element_text(size = 8))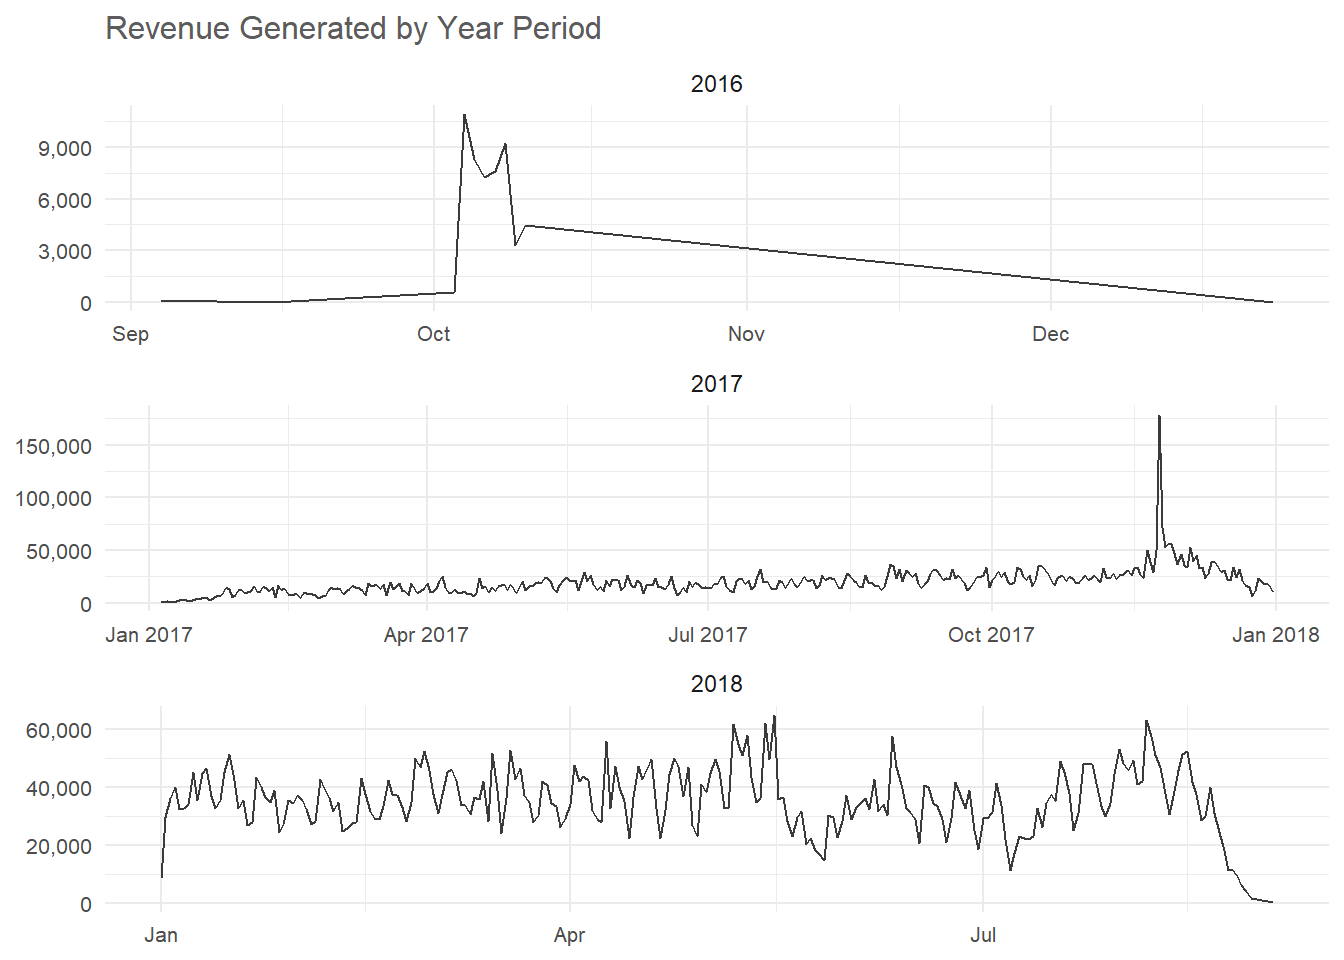
Based on the trend of revenue by year. First, we observed that revenue generated in 2016 fell below 9,000 and reached its peak in October, with a slight dip towards the end of the year. Similarly, in 2017, revenue mostly fell below 50,000, except in November when it reached its highest peak. After November, there was a minor consistent drop in revenue. This suggests that Olist experienced a surge in sales during the holiday season in November, but struggled to maintain that momentum in the following months.
Second, we noticed that in 2018, Olist's revenue became more volatile than in the previous years, with the most significant decline in revenue occurring after its highest peak in May-June and also August-September. This volatility could be attributed to changes in market conditions or customer behavior, which could have affected the platform’s revenue generation. It is worth noting that despite the fluctuations, the overall trend showed a relatively stable revenue generation pattern.
Finally, a common discovery was that revenue generally declined in December in both 2016 and 2017. This could be attributed to the fact that December is typically a slow month for seller on Olist due to the holiday season, as people focus on holiday preparations and travel rather than shopping. Overall, these findings provide valuable insights into the historical revenue performance of Olist.
Products
Analysis of the various products and their categories listed by several sellers on Olist.
What are the most popular product categories on Olist, and how do their sales volumes compare to each other?
orders |>
  left_join(order_payment, by = "order_id") |>
  left_join(select(order_items, order_id, product_id), by = "order_id") |>
  left_join(products, by = "product_id") |>
  filter(!order_status %in% c("canceled", "unavailable")) |>
  distinct() |>

  group_by(product_category_name) |>
  summarise(number_order = n_distinct(order_id),
            total_sales = sum(payment_value, na.rm = TRUE)) |>
  mutate(product_category_name = case_when(is.na(product_category_name) ~ "`No Category`",
                                           .default = product_category_name),
         percent_order = round(proportions(number_order)*100, 2),
         percent_revenue = round(proportions(total_sales)*100, 2)) |>
  select(product_category_name,
         number_order,
         percent_order,
         total_sales,
         percent_revenue) |>
  arrange(desc(total_sales)) |>

  clean_names(c("Product Category",
                "No. order",
                "No. order(%)",
                "Total Sales",
                "Sales(%)")) |>
  gt() |>
  fmt_integer(columns = `No. order`) |>
  fmt_number(columns = `Total Sales`) |>
  tab_style(style = cell_text(color = color_bold, weight = "bold"),
            locations = cells_body(columns = c(`No. order`, `Total Sales`))) |>
  interactive_gt(filter = TRUE)
The analysis of the product data revealed several interesting insights. First, we observed that the most purchased product category on the platform is Health Beauty, with a total of 8,800 purchases. This indicates that Olist’s customers tend to prioritize health beauty essentials when shopping on the platform.
Second, the other top five product categories range from Bed Bath Table to computer accessories, with a combined total of 38.5% of all purchased products. This suggests that Olist’s customers have diverse interests and preferences when it comes to shopping for products on the platform.
Finally, we noticed that Computers Accessories generated more sales in total than Furniture Decor, and together the top 5 product category make up 39.6% of the total sales generated. This indicates that Olist’s customers are willing to spend more on technology and Leisure items, which is useful information for sellers looking to sell similar products on the platform.
What is the average order value (AOV) on Olist, and how does this vary by product category?
The Average Order Value
The average order value is the average amount of money that customers spend on a single transaction or order.
order_payment |>
  summarise(total_revenue = sum(payment_value, na.rm = TRUE),
            number_of_orders = n_distinct(order_id),
            average_order_value = total_revenue / number_of_orders) |>
  clean_names() |>
  gt() |>
  fmt_number(decimals = 1) |>
  fmt_integer(columns = `Number Of Orders`) |>
  tab_style(style = css("text-align" = "center"),
            locations = cells_body()) |>
  tab_style(style = cell_text(color = color_bold, weight = "bold"),
locations = cells_body(columns = `Average Order Value`)) | Total Revenue | Number Of Orders | Average Order Value |
|---|---|---|
| 16,008,872.1 | 99,440 | 161.0 |
Based on the average order summary table presented, it can be observed that out of the 99,440 unique orders made, the overall average order value was 161.0. This means that the average order value for each purchase made on the Olist e-commerce platform for the stipulated time period was 161.0. This value is a useful metric for understanding the average amount of money customers are spending on each order. It could also be used as a benchmark for comparing the performance of Olist to other e-commerce platforms during that period, or for tracking changes in customer spending.
Average order value by products
orders |>
  left_join(order_payment, by = "order_id") |>
  left_join(select(order_items, order_id, product_id), by = "order_id") |>
  left_join(products, by = "product_id") |>
  distinct() |>

  group_by(product_category_name) |>
  summarise(total_revenue = sum(payment_value, na.rm = TRUE),
            number_of_orders = n_distinct(order_id),
            average_order_value = total_revenue / number_of_orders) |>
  arrange(desc(average_order_value)) |>

  clean_names() |>
  gt() |>
  fmt_number(decimals = 1) |>
  fmt_integer(columns = `Number Of Orders`) |>
  cols_label(`Product Category Name` = "Product Category",
             `Number Of Orders` = md("*No.* Orders")) |>
  tab_style(style = cell_fill(color = color_highlight),
            locations = cells_body(columns = `Average Order Value`)) |>
  interactive_gt(filter = TRUE)
The analysis of average order value by product category reveals that the top 5 product categories with the highest average order value are primarily technology, home appliances, and agricultural tools. This implies that customers are willing to spend more on these categories compared to other categories. With an average order value of 655., these categories are clearly some of the most valuable in terms of generating revenue.
It is also possible that sellers on Olist implemented marketing strategies to increase customer spending in these categories.
What where the top-selling products on Olist, and how have their sales trends changed over time?
Top selling product
temp <- orders |>
  left_join(order_payment, by = "order_id") |>
  left_join(order_items, by = "order_id", relationship = "many-to-many") |>
  left_join(products, by = "product_id") |>

  filter(!order_status %in% c("canceled", "unavailable")) |>
  group_by(product_id) |>
  summarise(number_of_order = n_distinct(order_id),
            total_sales = unique_sum(payment_value)) |>
  mutate(product_id_label = str_trunc(product_id, width = 12),
         percentage = proportions(total_sales)*100) |>
slice_max(order_by = total_sales, n = 10)ggplot(temp, aes(x = total_sales, y = fct_reorder(product_id_label, total_sales))) +
geom_col(fill = "#ABABAB") +
geom_text(aes(label = number_of_order), hjust = 1.2, color = "#333333") +
labs(x = "Total Revenue",
y = "Product Id",
title = "Top 10 Best Selling Products",
subtitle = "and Unique Purchase(In text)") +
scale_x_continuous(labels = scales::comma_format()) +
theme_minimal() +
theme(plot.title = element_text(color = color_title, size = 12),
plot.subtitle = element_text(color = "#777777", size = 10),
axis.title = element_text(color = color_axis_title, size = 9))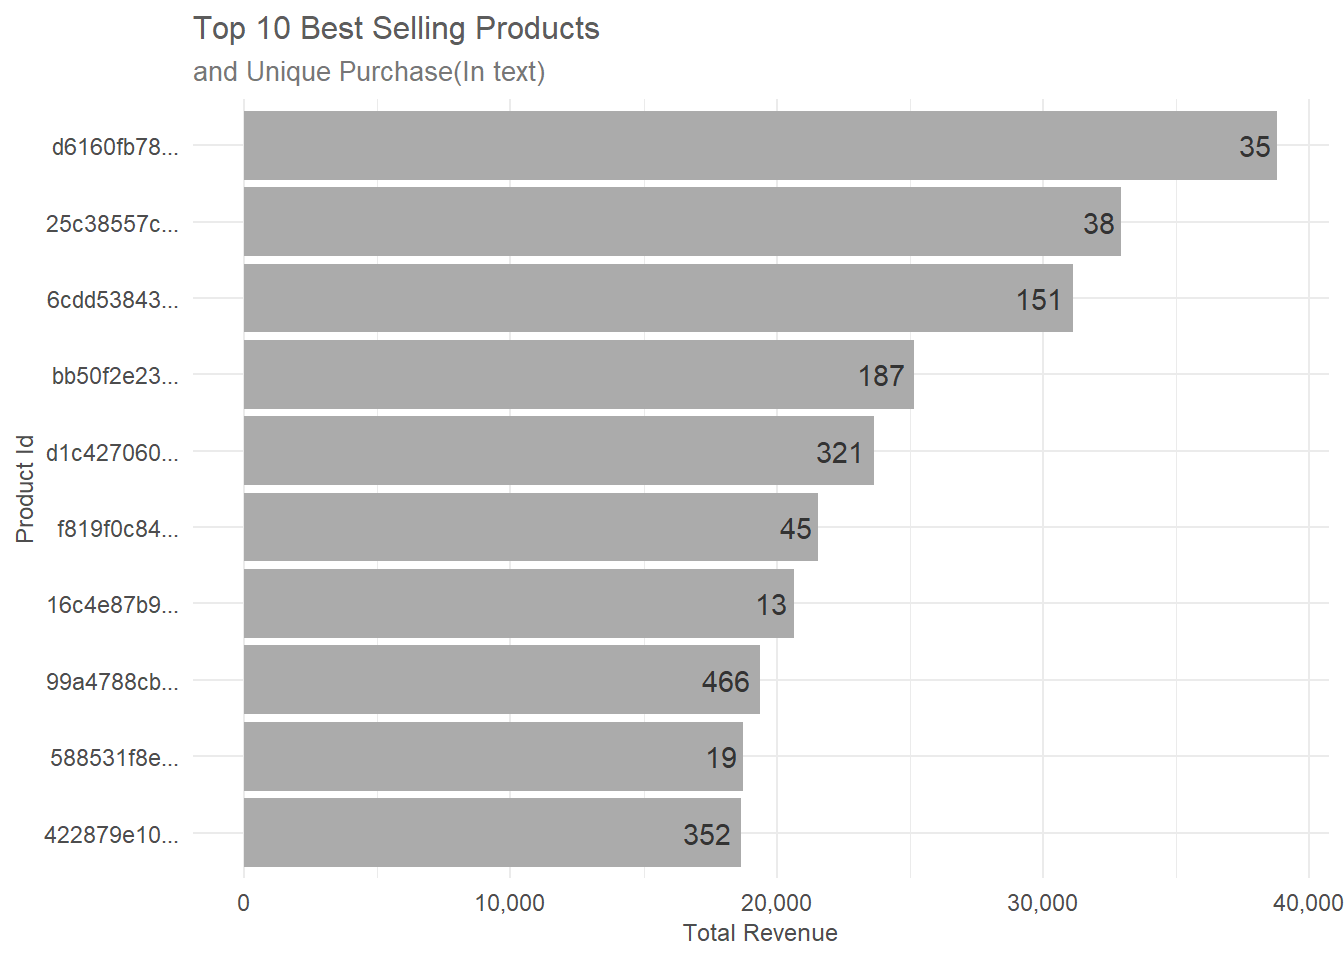
The bar chart above for the top 10 highest selling products shows that the highest sales made of any product is 38,803. The top 10 products have an average sales of 25,064, indicating a relatively high level of demand for these products. It is also interesting to note that the number of unique purchases for these products ranges from 19 to 466, suggesting that the products appeal to a diverse group of consumers. Despite the high sales figures, it is worth noting that the total sales ofthe top 10 products make up just 1.83% of all sales generated from 32,730 unique products. This suggests that there is a diverse range of products being sold on the Olist platform and that no single product dominates the market. Overall, this provide insights into consumer behavior and preferences on the Olist platform.
Sales trend over time
orders |>
  left_join(order_payment, by = "order_id") |>
  left_join(order_items, by = "order_id") |>
  left_join(products, by = "product_id") |>
  filter(!order_status %in% c("canceled", "unavailable"),
         product_id %in% temp$product_id) |>

  group_by(order_purchase_timestamp, product_id) |>
  summarise(total_sales = unique_sum(payment_value)) |>
  ungroup() |>
  filter(product_id != "5769ef0a239114ac3a854af00df129e4") |>

  ggplot(aes(x = order_purchase_timestamp,
             y = total_sales,
             group = 1)) +
  geom_line(show.legend = FALSE) +
  facet_wrap(facets = vars(product_id), ncol = 2, scales = "free_y") +
  labs(x = "Purchase Date",
       y = "revenue",
       title = "Top Product Sales Over Time") +
  scale_y_continuous(labels = scales::comma_format()) +
  theme_minimal() +
  theme(plot.title = element_text(colour = color_title, size = 11),
        axis.title = element_text(colour = color_axis_title, size = 8),
        axis.text = element_text(size = 8))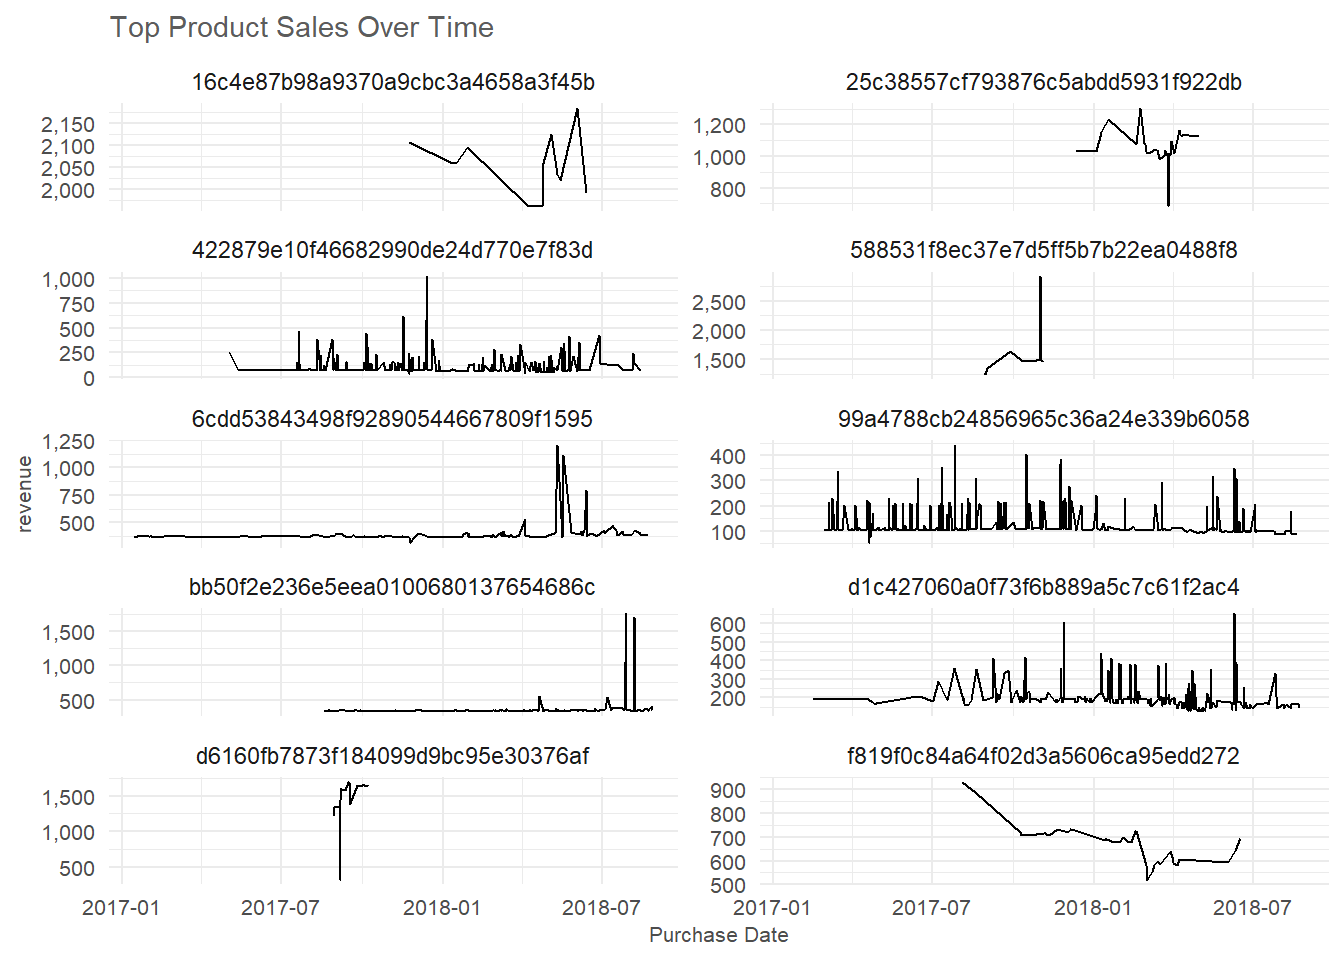
The above trend plot on sales across the stipulated period provides valuable insights into the sales patterns of the top 10 products. One noticeable observation is the presence of both high and low variability in sales across the products. Some products experienced significant fluctuations in sales over time, while others had more stable sales patterns. Another important point to note is that the frequency of purchase varies significantly across the top 10 products. Some products were purchased only a few times over the period, while others were purchased across many periods. Additionally, all products were purchased from 2017 upwards. Overall, the trend plot provides a useful summary of sales patterns over time for the top 10 products.
Orders
How many orders were placed on Olist, and how does this vary by month or season?
temp <- orders |>
  mutate(order_day = day(order_purchase_timestamp),
         order_month = month(order_purchase_timestamp, label= TRUE, abbr= TRUE),
         order_year = year(order_purchase_timestamp),
         order_date = date(order_purchase_timestamp))
temp |>
group_by(order_day, order_year) |>
summarise(number_of_orders = n()) |>
ggplot(aes(x = order_day,
y = number_of_orders,
group = 1)) +
geom_line(color = color_line, show.legend = FALSE) +
facet_wrap(vars(order_year), ncol = 1, scales = "free_y") +
labs(x = "Days of the Month",
y = "No. Orders",
title = "Number Of Orders in Each Day") +
scale_y_continuous(labels = scales::comma_format()) +
scale_x_continuous(breaks = seq(1, 31, 2)) +
theme_minimal() +
theme(plot.title = element_text(color = color_title, size = 12),
axis.title = element_text(color = color_axis_title, size = 9))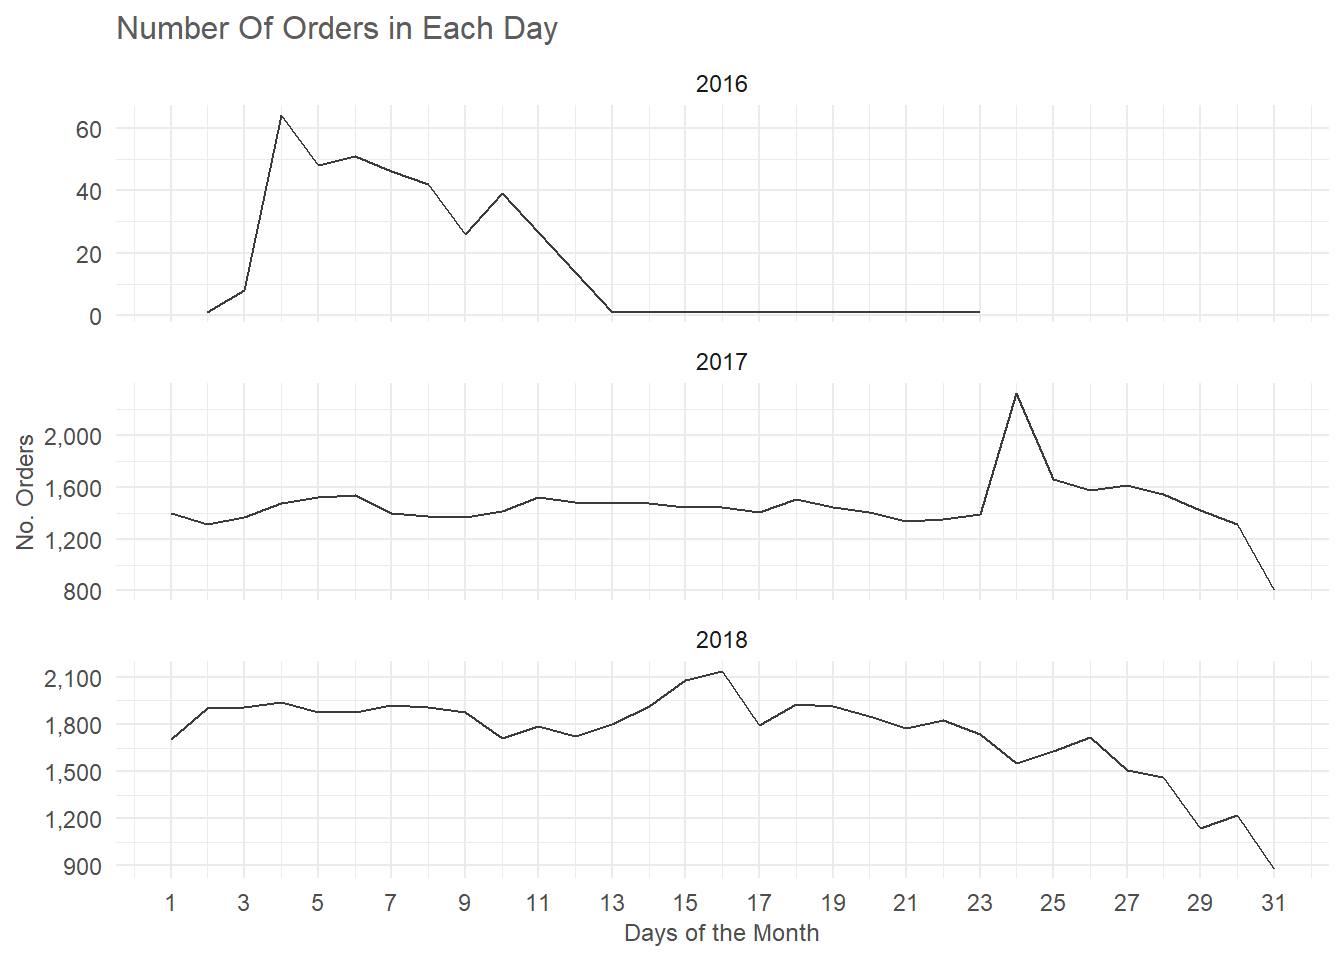
The plot above provides insight into the number of orders placed on Olist platform over the years. From the plot, it is clear that there was a low number of orders in 2016 compared to the subsequent years. In 2017, the average number of orders per day was 1,455, with the highest number of orders occurring on the 24th day. The trend for 2018 was slightly different, with an average number of orders per day of 1,742. The most orders on a particular day in 2018 happened on the 16th day, after which the number of orders steadily declined down to the 31st day. These trends in the number of orders over time provides useful insights to Olist platform in terms of past demands and planning for inventory management.
By month
temp |>
  group_by(order_month, order_year) |>
  summarise(number_of_orders = n()) |>

  ggplot(aes(x = order_month,
             y = number_of_orders,
             group = 1)) +
  geom_line(color = color_line, show.legend = FALSE) +
  facet_wrap(vars(order_year), ncol = 1, scales = "free_y") +
  labs(x = NULL,
       y = "No. Orders",
       title = "Orders Volume by Month") +
  scale_y_continuous(labels = scales::comma_format()) +
  theme_minimal() +
  theme(plot.title = element_text(color = color_title, size = 12),
        axis.title = element_text(color = color_axis_title, size = 9))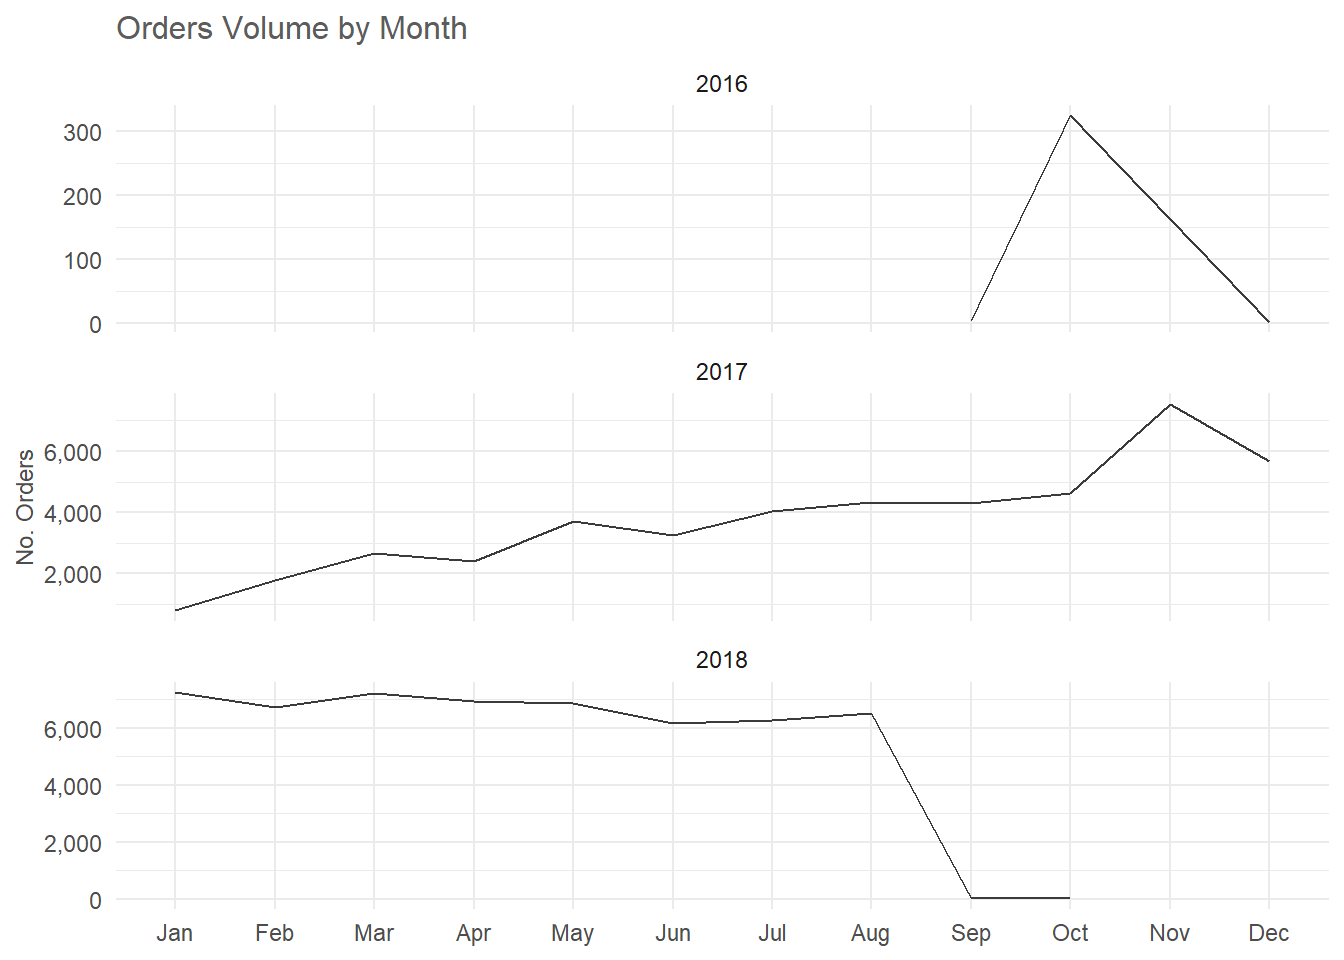
The analysis of the total number of orders made in each month across all years shows an interesting trend. There was a steady increase in the total number of orders made in 2017 except for some months such as April, June, and December when the number of orders declined. This could be attributed to seasonal factors, as December is typically a month where people are focused on holiday preparations and less on making purchases. In contrast, 2018 saw a steep decline in the total number of orders from April to September, with the biggest decline happening from August to September where there was a difference of 6,496 orders. This significant decline suggests that there might have been external factors that affected customer behavior during this period. It could be worthwhile to investigate if there was any significant event or change that happened during that time that could have influenced customer purchase behavior.
By date
temp |>
  group_by(order_date, order_year) |>
  summarise(number_of_orders = n()) |>

  ggplot(aes(x = order_date,
             y = number_of_orders,
             group = 1)) +
  geom_line(color = color_line, show.legend = FALSE) +
  facet_wrap(vars(order_year), ncol = 1, scales = "free") +
  labs(x = "Order Date",
       y = "No. Order",
       title = "Orders Volume") +
  scale_y_continuous(labels = scales::comma_format()) +
  theme_minimal() +
  theme(plot.title = element_text(color = color_title, size = 12),
        axis.title = element_text(color = color_axis_title, size = 9),
        axis.text.x = element_text(size = 8))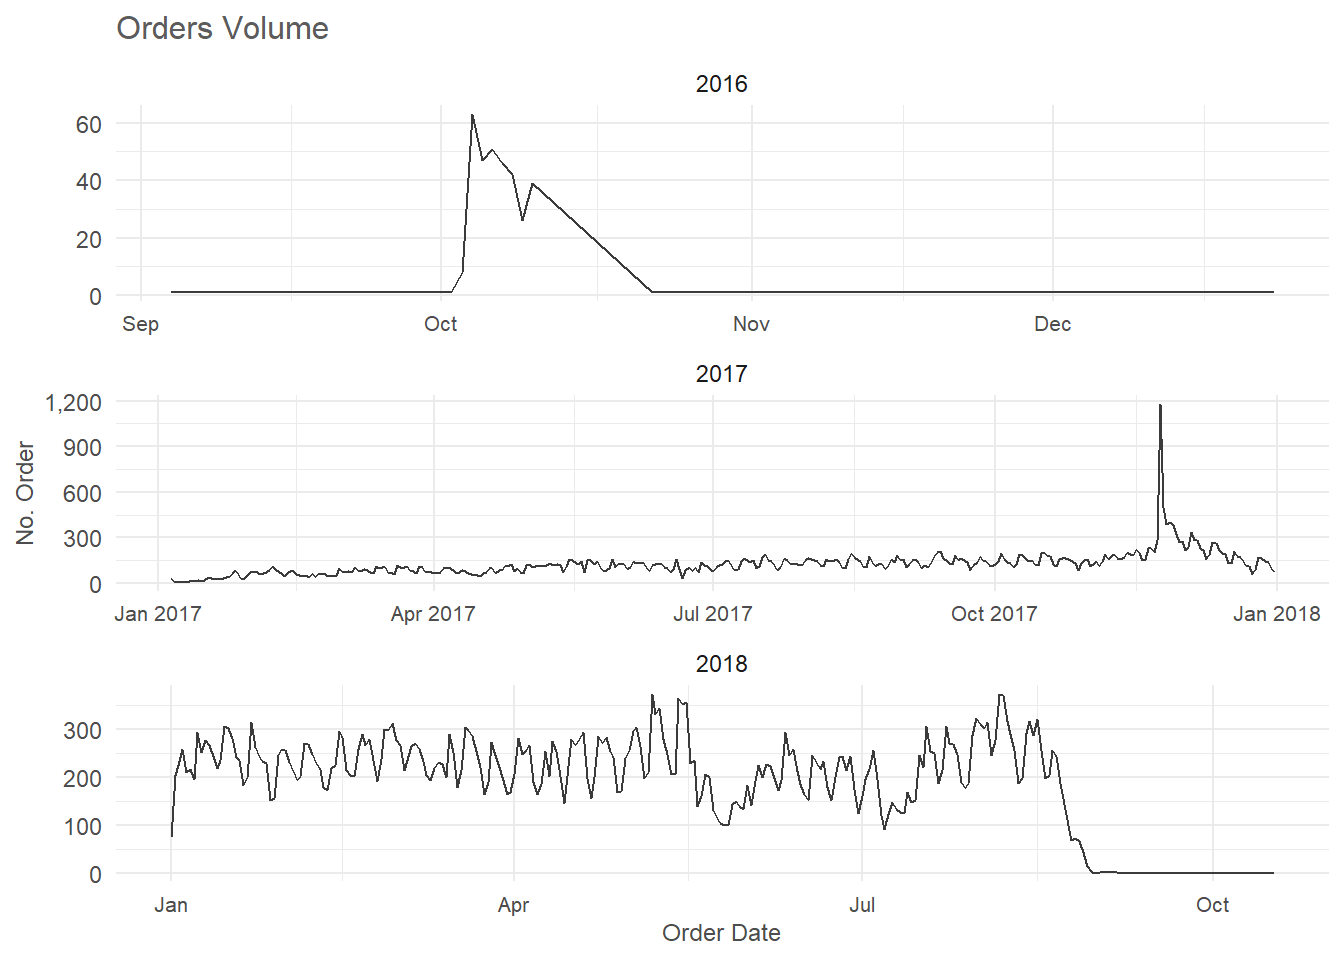
The plot on total orders across each year shows a similar trend to that of the total amount of sales generated. Just like the amount of sales, the total number of orders also exhibits a seasonal trend. There was a significant increase in orders in the last quarter of 2017, with the peak occurring in November from 23rd to 29th. The highest number of orders for this period was recorded on the 24th, which was the Black Friday sales day. However, this peak period was relatively short-lived, and the number of orders declined sharply after that week. The trend for 2018 was also similar, with a high number of orders in the second and third quarter, followed by a significant decline from August to October. This volatility is consistent with the trend observed for the total amount of sales during the stipulated period, suggesting that the number of orders is a good indicator of sales performance for the Olist e-commerce platform.
What is the average order cancellation rate on Olist, and how does this impact seller performance?.
Before running the analysis for the average rate of order cancellation, a summary of the distribution of order status can provide more insight into the number of orders.
orders |>
  count(order_status, sort = TRUE, name = "number_of_order") |>
  mutate(percentage = proportions(number_of_order)*100,
         order_status = str_to_title(order_status)) |>

  clean_names() |>
  gt(rowname_col = "Order Status") |>
  fmt_number(columns = `Number Of Order`, decimals = 0) |>
  fmt_number(columns = Percentage) |>
cols_label(`Number Of Order` = md("*No.* Order"))| No. Order | Percentage | |
|---|---|---|
| Delivered | 96,478 | 97.02 |
| Shipped | 1,107 | 1.11 |
| Canceled | 625 | 0.63 |
| Unavailable | 609 | 0.61 |
| Invoiced | 314 | 0.32 |
| Processing | 301 | 0.30 |
| Created | 5 | 0.01 |
| Approved | 2 | 0.00 |
Based on the order status summary, it appears that the majority of orders (97%) were delivered successfully to customers. This suggests that the company has a strong delivery process in place, which is crucial for customer satisfaction and loyalty. However, it is worth noting that a small percentage of orders (0.63%) were canceled, which could be due to various reasons such as stock unavailability or customer requests. Additionally, 0.61% of orders were unavailable, which could indicate that there where some flaws in inventory management system that prevented the availability of products for customers to purchase.
orders |>
  left_join(order_items, by = "order_id") |>
  left_join(sellers, by = "seller_id") |>
  left_join(order_payment, by = "order_id") |>
  distinct() |>

  group_by(seller_id, order_status) |>
  summarise(count = n(),
            average_revenue = mean(payment_value, na.rm = TRUE)) |>
  mutate(percentage_of_seller_order = proportions(count)*100,
         seller_id = if_else(is.na(seller_id), "No Sellers", seller_id),
         seller_id = str_trunc(seller_id, width = 15)) |>

  filter(order_status == "canceled") |>
  ungroup() |>
  arrange(desc(count)) |>
  rename(number_of_canceled = count) |>
  select(-order_status)  |>

  clean_names() |>
  gt() |>
  fmt_number(columns = c(`Average Revenue`, `Percentage Of Seller Order`)) |>
  cols_label(`Number Of Canceled` = md("*No.* Canceled")) |>
  interactive_gt()
The summary table on sellers’ average cancellation rate provides insightful information on the performance of the sellers on the Olist platform. It shows that sellers with canceled orders have an average cancellation rate of 22.3%. However, it is noteworthy that the majority of sellers on the platform do not have any canceled orders, and their sales generate an average of 224 with a median of 132. On the other hand, sellers with canceled orders generate an average of 220 with a median of 115. This indicates that while canceled orders can affect a seller’s reputation, it may not necessarily lead to a significant drop in sales.
Which payment methods are most commonly used by Olist customers, and how does this vary by product category or geographic region?
The most used payment method
orders |>
  left_join(order_payment, by = "order_id") |>
  mutate(payment_type = if_else(is.na(payment_type), "Not Defined", payment_type)) |>
  count(payment_type, sort = TRUE, name = "Count") |>
  mutate(percentage = proportions(Count)*100) |>

  clean_names(c("Payment Method", "Number of Order", "Percentage")) |>
  gt() |>
  fmt_integer() |>
  fmt_number(columns = Percentage) |>
  tab_style(style = cell_text(color = color_bold, weight = "bold"),
locations = cells_body(columns = `Number of Order`))| Payment Method | Number of Order | Percentage |
|---|---|---|
| Credit Card | 76,795 | 73.92 |
| Boleto | 19,784 | 19.04 |
| Voucher | 5,775 | 5.56 |
| Debit Card | 1,529 | 1.47 |
| Not Defined | 4 | 0.00 |
Based on the summary of orders by payment method, it is clear that the credit card payment option is the most popular payment method for customers. It accounts for about 73.92% of all orders. This could be because credit cards were widely accepted, easy to use and offer customers the convenience of making payments. On the other hand, the use of debit cards for payments is relatively low, accounting for just 1.47% of all orders. This could be because some customers prefer credit cards, or it could be due to the limited use of debit cards in certain regions. Nonetheless, the analysis shows that credit card payments are the preferred payment method for customers.
By product category
orders |>
  left_join(order_payment, by = "order_id") |>
  left_join(order_items, by = "order_id") |>
  left_join(products, by = "product_id") |>
  distinct() |>

  group_by(product_category_name, payment_type) |>
  summarise(count = n_distinct(order_id)) |>
  arrange(desc(count), product_category_name, desc(count)) |>
  mutate(prop_payment_type = proportions(count)*100,
         payment_type = if_else(is.na(payment_type), "No Specified Method", payment_type)) |>

  clean_names(c("c", "Payment Method", "Orders", "(%) by Payment Method")) |>
  gt() |>
  fmt_integer(columns = Orders) |>
  fmt_number(columns = `(%) by Payment Method`) |>
  tab_options(column_labels.font.size = 15,
              column_labels.font.weight = "bold",
              row_group.background.color = "#FAFAFA",
row_group.font.size = 13)| Payment Method | Orders | (%) by Payment Method |
|---|---|---|
| Bed Bath Table | ||
| Credit Card | 7,540 | 77.93 |
| Boleto | 1,601 | 16.55 |
| Voucher | 414 | 4.28 |
| Debit Card | 120 | 1.24 |
| Health Beauty | ||
| Credit Card | 6,874 | 76.61 |
| Boleto | 1,704 | 18.99 |
| Voucher | 248 | 2.76 |
| Debit Card | 146 | 1.63 |
| No Specified Method | 1 | 0.01 |
| Sports Leisure | ||
| Credit Card | 5,904 | 74.90 |
| Boleto | 1,586 | 20.12 |
| Voucher | 274 | 3.48 |
| Debit Card | 118 | 1.50 |
| Furniture Decor | ||
| Credit Card | 4,919 | 74.44 |
| Boleto | 1,339 | 20.26 |
| Voucher | 273 | 4.13 |
| Debit Card | 77 | 1.17 |
| Computers Accessories | ||
| Credit Card | 4,737 | 69.40 |
| Boleto | 1,723 | 25.24 |
| Voucher | 228 | 3.34 |
| Debit Card | 138 | 2.02 |
| Housewares | ||
| Credit Card | 4,613 | 76.31 |
| Boleto | 1,044 | 17.27 |
| Voucher | 286 | 4.73 |
| Debit Card | 102 | 1.69 |
| Watches Gifts | ||
| Credit Card | 4,568 | 79.58 |
| Boleto | 922 | 16.06 |
| Voucher | 192 | 3.34 |
| Debit Card | 58 | 1.01 |
| Telephony | ||
| Credit Card | 3,108 | 72.50 |
| Boleto | 945 | 22.04 |
| Voucher | 157 | 3.66 |
| Debit Card | 77 | 1.80 |
| Toys | ||
| Credit Card | 3,105 | 78.25 |
| Boleto | 685 | 17.26 |
| Voucher | 135 | 3.40 |
| Debit Card | 43 | 1.08 |
| Auto | ||
| Credit Card | 2,988 | 75.06 |
| Boleto | 783 | 19.67 |
| Voucher | 140 | 3.52 |
| Debit Card | 70 | 1.76 |
| Cool Stuff | ||
| Credit Card | 2,858 | 76.68 |
| Boleto | 684 | 18.35 |
| Voucher | 149 | 4.00 |
| Debit Card | 36 | 0.97 |
| Garden Tools | ||
| Credit Card | 2,603 | 72.29 |
| Boleto | 814 | 22.60 |
| Voucher | 135 | 3.75 |
| Debit Card | 49 | 1.36 |
| Perfumery | ||
| Credit Card | 2,501 | 77.43 |
| Boleto | 535 | 16.56 |
| Voucher | 150 | 4.64 |
| Debit Card | 44 | 1.36 |
| Baby | ||
| Credit Card | 2,288 | 77.61 |
| Boleto | 504 | 17.10 |
| Voucher | 113 | 3.83 |
| Debit Card | 43 | 1.46 |
| Electronics | ||
| Credit Card | 1,852 | 71.62 |
| Boleto | 608 | 23.51 |
| Debit Card | 65 | 2.51 |
| Voucher | 61 | 2.36 |
| Stationery | ||
| Credit Card | 1,829 | 77.40 |
| Boleto | 413 | 17.48 |
| Voucher | 86 | 3.64 |
| Debit Card | 35 | 1.48 |
| NA | ||
| Credit Card | 1,636 | 71.60 |
| Boleto | 449 | 19.65 |
| Voucher | 163 | 7.13 |
| Debit Card | 34 | 1.49 |
| Not Defined | 3 | 0.13 |
| Fashion Bags Accessories | ||
| Credit Card | 1,392 | 71.68 |
| Boleto | 388 | 19.98 |
| Voucher | 132 | 6.80 |
| Debit Card | 30 | 1.54 |
| Pet Shop | ||
| Credit Card | 1,342 | 76.64 |
| Boleto | 311 | 17.76 |
| Voucher | 66 | 3.77 |
| Debit Card | 32 | 1.83 |
| Office Furniture | ||
| Credit Card | 897 | 69.00 |
| Boleto | 352 | 27.08 |
| Voucher | 38 | 2.92 |
| Debit Card | 13 | 1.00 |
| Luggage Accessories | ||
| Credit Card | 836 | 78.28 |
| Boleto | 158 | 14.79 |
| Voucher | 61 | 5.71 |
| Debit Card | 13 | 1.22 |
| Consoles Games | ||
| Credit Card | 806 | 73.61 |
| Boleto | 228 | 20.82 |
| Voucher | 45 | 4.11 |
| Debit Card | 16 | 1.46 |
| Home Appliances | ||
| Credit Card | 610 | 78.41 |
| Boleto | 136 | 17.48 |
| Voucher | 24 | 3.08 |
| Debit Card | 8 | 1.03 |
| Construction Tools Construction | ||
| Credit Card | 582 | 76.88 |
| Boleto | 146 | 19.29 |
| Voucher | 15 | 1.98 |
| Debit Card | 14 | 1.85 |
| Small Appliances | ||
| Credit Card | 491 | 76.84 |
| Boleto | 121 | 18.94 |
| Voucher | 16 | 2.50 |
| Debit Card | 11 | 1.72 |
| Musical Instruments | ||
| Credit Card | 466 | 72.93 |
| Boleto | 136 | 21.28 |
| Voucher | 27 | 4.23 |
| Debit Card | 10 | 1.56 |
| Home Construction | ||
| Credit Card | 397 | 79.24 |
| Boleto | 84 | 16.77 |
| Voucher | 15 | 2.99 |
| Debit Card | 5 | 1.00 |
| Books General Interest | ||
| Credit Card | 380 | 72.94 |
| Boleto | 120 | 23.03 |
| Voucher | 15 | 2.88 |
| Debit Card | 6 | 1.15 |
| Furniture Living Room | ||
| Credit Card | 330 | 75.69 |
| Boleto | 78 | 17.89 |
| Voucher | 19 | 4.36 |
| Debit Card | 9 | 2.06 |
| Food | ||
| Credit Card | 328 | 71.93 |
| Boleto | 99 | 21.71 |
| Debit Card | 16 | 3.51 |
| Voucher | 13 | 2.85 |
| Home Confort | ||
| Credit Card | 319 | 78.96 |
| Boleto | 65 | 16.09 |
| Voucher | 14 | 3.47 |
| Debit Card | 6 | 1.49 |
| Audio | ||
| Credit Card | 254 | 70.17 |
| Boleto | 79 | 21.82 |
| Voucher | 21 | 5.80 |
| Debit Card | 8 | 2.21 |
| Drinks | ||
| Credit Card | 234 | 77.48 |
| Boleto | 51 | 16.89 |
| Debit Card | 12 | 3.97 |
| Voucher | 5 | 1.66 |
| Market Place | ||
| Credit Card | 198 | 67.81 |
| Boleto | 73 | 25.00 |
| Voucher | 18 | 6.16 |
| Debit Card | 3 | 1.03 |
| Fashion Shoes | ||
| Credit Card | 195 | 78.95 |
| Boleto | 38 | 15.38 |
| Voucher | 11 | 4.45 |
| Debit Card | 3 | 1.21 |
| Air Conditioning | ||
| Credit Card | 192 | 75.00 |
| Boleto | 54 | 21.09 |
| Voucher | 7 | 2.73 |
| Debit Card | 3 | 1.17 |
| Books Technical | ||
| Credit Card | 190 | 72.52 |
| Boleto | 64 | 24.43 |
| Debit Card | 5 | 1.91 |
| Voucher | 3 | 1.15 |
| Kitchen Dining Laundry Garden Furniture | ||
| Credit Card | 190 | 75.40 |
| Boleto | 47 | 18.65 |
| Voucher | 9 | 3.57 |
| Debit Card | 6 | 2.38 |
| Home Appliances 2 | ||
| Credit Card | 182 | 76.79 |
| Boleto | 44 | 18.57 |
| Voucher | 6 | 2.53 |
| Debit Card | 5 | 2.11 |
| Industry Commerce And Business | ||
| Credit Card | 182 | 76.47 |
| Boleto | 50 | 21.01 |
| Voucher | 4 | 1.68 |
| Debit Card | 2 | 0.84 |
| Construction Tools Lights | ||
| Credit Card | 181 | 72.69 |
| Boleto | 51 | 20.48 |
| Debit Card | 9 | 3.61 |
| Voucher | 8 | 3.21 |
| Food Drink | ||
| Credit Card | 164 | 70.69 |
| Boleto | 55 | 23.71 |
| Voucher | 11 | 4.74 |
| Debit Card | 2 | 0.86 |
| Fixed Telephony | ||
| Credit Card | 162 | 72.65 |
| Boleto | 49 | 21.97 |
| Voucher | 9 | 4.04 |
| Debit Card | 3 | 1.35 |
| Costruction Tools Garden | ||
| Credit Card | 155 | 77.89 |
| Boleto | 38 | 19.10 |
| Voucher | 5 | 2.51 |
| Debit Card | 1 | 0.50 |
| Computers | ||
| Credit Card | 152 | 80.85 |
| Boleto | 29 | 15.43 |
| Voucher | 7 | 3.72 |
| Art | ||
| Credit Card | 147 | 70.33 |
| Boleto | 46 | 22.01 |
| Voucher | 10 | 4.78 |
| Debit Card | 6 | 2.87 |
| Agro Industry And Commerce | ||
| Credit Card | 125 | 67.20 |
| Boleto | 51 | 27.42 |
| Voucher | 6 | 3.23 |
| Debit Card | 4 | 2.15 |
| Construction Tools Safety | ||
| Credit Card | 125 | 72.67 |
| Boleto | 39 | 22.67 |
| Voucher | 6 | 3.49 |
| Debit Card | 2 | 1.16 |
| Christmas Supplies | ||
| Credit Card | 98 | 75.38 |
| Boleto | 29 | 22.31 |
| Voucher | 2 | 1.54 |
| Debit Card | 1 | 0.77 |
| Signaling And Security | ||
| Credit Card | 94 | 67.14 |
| Boleto | 40 | 28.57 |
| Debit Card | 3 | 2.14 |
| Voucher | 3 | 2.14 |
| Fashion Underwear Beach | ||
| Credit Card | 92 | 73.02 |
| Boleto | 25 | 19.84 |
| Voucher | 8 | 6.35 |
| Debit Card | 1 | 0.79 |
| Fashion Male Clothing | ||
| Credit Card | 89 | 74.79 |
| Boleto | 19 | 15.97 |
| Voucher | 10 | 8.40 |
| Debit Card | 1 | 0.84 |
| Costruction Tools Tools | ||
| Credit Card | 74 | 74.75 |
| Boleto | 21 | 21.21 |
| Voucher | 3 | 3.03 |
| Debit Card | 1 | 1.01 |
| Furniture Bedroom | ||
| Credit Card | 66 | 68.75 |
| Boleto | 26 | 27.08 |
| Voucher | 3 | 3.12 |
| Debit Card | 1 | 1.04 |
| Small Appliances Home Oven And Coffee | ||
| Credit Card | 64 | 85.33 |
| Boleto | 9 | 12.00 |
| Debit Card | 1 | 1.33 |
| Voucher | 1 | 1.33 |
| Tablets Printing Image | ||
| Credit Card | 62 | 75.61 |
| Boleto | 17 | 20.73 |
| Voucher | 3 | 3.66 |
| Dvds Blu Ray | ||
| Credit Card | 44 | 72.13 |
| Boleto | 14 | 22.95 |
| Voucher | 3 | 4.92 |
| Cine Photo | ||
| Credit Card | 42 | 63.64 |
| Boleto | 19 | 28.79 |
| Debit Card | 3 | 4.55 |
| Voucher | 2 | 3.03 |
| Books Imported | ||
| Credit Card | 41 | 75.93 |
| Boleto | 12 | 22.22 |
| Voucher | 1 | 1.85 |
| Furniture Mattress And Upholstery | ||
| Credit Card | 32 | 82.05 |
| Boleto | 6 | 15.38 |
| Voucher | 1 | 2.56 |
| Music | ||
| Credit Card | 28 | 71.79 |
| Boleto | 9 | 23.08 |
| Voucher | 2 | 5.13 |
| Fashio Female Clothing | ||
| Credit Card | 27 | 69.23 |
| Boleto | 11 | 28.21 |
| Voucher | 1 | 2.56 |
| Party Supplies | ||
| Credit Card | 27 | 67.50 |
| Boleto | 10 | 25.00 |
| Debit Card | 2 | 5.00 |
| Voucher | 1 | 2.50 |
| Flowers | ||
| Credit Card | 22 | 75.86 |
| Boleto | 7 | 24.14 |
| Diapers And Hygiene | ||
| Credit Card | 20 | 74.07 |
| Boleto | 7 | 25.93 |
| Fashion Sport | ||
| Credit Card | 17 | 62.96 |
| Boleto | 9 | 33.33 |
| Voucher | 1 | 3.70 |
| Home Comfort 2 | ||
| Credit Card | 17 | 68.00 |
| Boleto | 6 | 24.00 |
| Voucher | 2 | 8.00 |
| Arts And Craftmanship | ||
| Credit Card | 13 | 56.52 |
| Boleto | 7 | 30.43 |
| Debit Card | 3 | 13.04 |
| La Cuisine | ||
| Credit Card | 12 | 80.00 |
| Voucher | 2 | 13.33 |
| Boleto | 1 | 6.67 |
| Cds Dvds Musicals | ||
| Credit Card | 9 | 75.00 |
| Boleto | 3 | 25.00 |
| Portateis Cozinha E Preparadores De Alimentos | ||
| Credit Card | 8 | 57.14 |
| Boleto | 4 | 28.57 |
| Debit Card | 2 | 14.29 |
| Fashion Childrens Clothes | ||
| Credit Card | 5 | 62.50 |
| Boleto | 3 | 37.50 |
| Pc Gamer | ||
| Credit Card | 5 | 55.56 |
| Boleto | 2 | 22.22 |
| Debit Card | 1 | 11.11 |
| Voucher | 1 | 11.11 |
| Security And Services | ||
| Boleto | 1 | 50.00 |
| Credit Card | 1 | 50.00 |
Based on the table, it is clear that credit card payment is the most preferred payment method for customers across all product categories. The data shows that credit card had an average of 73% of all purchases for each product category. Boleto, voucher and debit card payment options follow credit card payment in that order of preference. This trend is observed across almost all product categories, as the preference for payment options remains relatively consistent.
temp <- orders |>
  left_join(order_payment, by = "order_id") |>
  left_join(order_items, by = "order_id") |>
  left_join(customers, by = "customer_id") |>
  distinct()
By geographic region
temp |>
  group_by(customer_state_name, payment_type) |>
  summarise(count = n_distinct(order_id)) |>
  arrange(desc(count), customer_state_name, desc(count)) |>
  mutate(prop_payment_type = proportions(count)*100,
         payment_type = if_else(is.na(payment_type), "No Specified Method", payment_type)) |>

  clean_names(c("c", "Payment Method", "Orders", "(%) by Paymant Method")) |>
  gt() |>
  fmt_integer(columns = Orders) |>
  fmt_number(columns = `(%) by Paymant Method`) |>
  tab_options(column_labels.font.size = 15,
              column_labels.font.weight = "bold",
              row_group.background.color = "#FAFAFA",
row_group.font.size = 13)| Payment Method | Orders | (%) by Paymant Method |
|---|---|---|
| São Paulo | ||
| Credit Card | 32,074 | 75.22 |
| Boleto | 8,205 | 19.24 |
| Voucher | 1,596 | 3.74 |
| Debit Card | 759 | 1.78 |
| Not Defined | 3 | 0.01 |
| No Specified Method | 1 | 0.00 |
| Rio de Janeiro | ||
| Credit Card | 10,253 | 77.98 |
| Boleto | 2,163 | 16.45 |
| Voucher | 547 | 4.16 |
| Debit Card | 185 | 1.41 |
| Minas Gerais | ||
| Credit Card | 9,030 | 75.81 |
| Boleto | 2,304 | 19.34 |
| Voucher | 438 | 3.68 |
| Debit Card | 139 | 1.17 |
| Rio Grande do Sul | ||
| Credit Card | 3,967 | 71.08 |
| Boleto | 1,359 | 24.35 |
| Voucher | 179 | 3.21 |
| Debit Card | 76 | 1.36 |
| Paraná | ||
| Credit Card | 3,776 | 73.08 |
| Boleto | 1,118 | 21.64 |
| Voucher | 199 | 3.85 |
| Debit Card | 74 | 1.43 |
| Santa Catarina | ||
| Credit Card | 2,705 | 72.75 |
| Boleto | 840 | 22.59 |
| Voucher | 127 | 3.42 |
| Debit Card | 46 | 1.24 |
| Bahia | ||
| Credit Card | 2,643 | 75.82 |
| Boleto | 614 | 17.61 |
| Voucher | 176 | 5.05 |
| Debit Card | 53 | 1.52 |
| Distrito Federal | ||
| Credit Card | 1,695 | 77.50 |
| Boleto | 396 | 18.11 |
| Voucher | 79 | 3.61 |
| Debit Card | 17 | 0.78 |
| Espírito Santo | ||
| Credit Card | 1,568 | 75.38 |
| Boleto | 403 | 19.38 |
| Voucher | 82 | 3.94 |
| Debit Card | 27 | 1.30 |
| Goiás | ||
| Credit Card | 1,514 | 73.46 |
| Boleto | 449 | 21.79 |
| Voucher | 76 | 3.69 |
| Debit Card | 22 | 1.07 |
| Pernambuco | ||
| Credit Card | 1,326 | 78.23 |
| Boleto | 277 | 16.34 |
| Voucher | 73 | 4.31 |
| Debit Card | 19 | 1.12 |
| Ceará | ||
| Credit Card | 1,083 | 79.22 |
| Boleto | 205 | 15.00 |
| Voucher | 59 | 4.32 |
| Debit Card | 20 | 1.46 |
| Pará | ||
| Credit Card | 724 | 72.69 |
| Boleto | 215 | 21.59 |
| Voucher | 41 | 4.12 |
| Debit Card | 16 | 1.61 |
| MatoGrosso | ||
| Credit Card | 657 | 70.95 |
| Boleto | 238 | 25.70 |
| Voucher | 25 | 2.70 |
| Debit Card | 6 | 0.65 |
| Maranhão | ||
| Credit Card | 534 | 70.26 |
| Boleto | 203 | 26.71 |
| Voucher | 19 | 2.50 |
| Debit Card | 4 | 0.53 |
| MatoGrosso do Sul | ||
| Credit Card | 516 | 71.07 |
| Boleto | 175 | 24.10 |
| Voucher | 24 | 3.31 |
| Debit Card | 11 | 1.52 |
| Paraíba | ||
| Credit Card | 421 | 76.55 |
| Boleto | 93 | 16.91 |
| Voucher | 23 | 4.18 |
| Debit Card | 13 | 2.36 |
| Rio Grande do Norte | ||
| Credit Card | 390 | 78.00 |
| Boleto | 80 | 16.00 |
| Voucher | 21 | 4.20 |
| Debit Card | 9 | 1.80 |
| Piauí | ||
| Credit Card | 383 | 74.37 |
| Boleto | 94 | 18.25 |
| Voucher | 27 | 5.24 |
| Debit Card | 11 | 2.14 |
| Alagoas | ||
| Credit Card | 338 | 80.29 |
| Boleto | 68 | 16.15 |
| Voucher | 10 | 2.38 |
| Debit Card | 5 | 1.19 |
| Sergipe | ||
| Credit Card | 263 | 73.46 |
| Boleto | 75 | 20.95 |
| Voucher | 15 | 4.19 |
| Debit Card | 5 | 1.40 |
| Tocantins | ||
| Credit Card | 196 | 68.06 |
| Boleto | 76 | 26.39 |
| Voucher | 12 | 4.17 |
| Debit Card | 4 | 1.39 |
| Rondônia | ||
| Credit Card | 184 | 71.32 |
| Boleto | 64 | 24.81 |
| Voucher | 7 | 2.71 |
| Debit Card | 3 | 1.16 |
| Amazonas | ||
| Credit Card | 124 | 82.12 |
| Boleto | 21 | 13.91 |
| Voucher | 4 | 2.65 |
| Debit Card | 2 | 1.32 |
| Acre | ||
| Credit Card | 61 | 73.49 |
| Boleto | 16 | 19.28 |
| Voucher | 4 | 4.82 |
| Debit Card | 2 | 2.41 |
| Amapá | ||
| Credit Card | 47 | 67.14 |
| Boleto | 20 | 28.57 |
| Voucher | 3 | 4.29 |
| Roraima | ||
| Credit Card | 33 | 71.74 |
| Boleto | 13 | 28.26 |
temp |>
  group_by(customer_region, payment_type) |>
  summarise(count = n_distinct(order_id)) |>
  arrange(desc(count), customer_region, desc(count)) |>
  mutate(prop_payment_type = proportions(count)*100,
         payment_type = if_else(is.na(payment_type), "No Specified Method", payment_type)) |>

  clean_names(c("c", "Payment Method", "Orders", "(%) by Paymant Method")) |>
  gt() |>
  fmt_integer(columns = Orders) |>
  fmt_number(columns = `(%) by Paymant Method`) |>
  tab_options(column_labels.font.size = 15,
              column_labels.font.weight = "bold",
              row_group.background.color = "#FAFAFA",
row_group.font.size = 13)| Payment Method | Orders | (%) by Paymant Method |
|---|---|---|
| South East | ||
| Credit Card | 52,925 | 75.85 |
| Boleto | 13,075 | 18.74 |
| Voucher | 2,663 | 3.82 |
| Debit Card | 1,110 | 1.59 |
| Not Defined | 3 | 0.00 |
| No Specified Method | 1 | 0.00 |
| South | ||
| Credit Card | 10,448 | 72.22 |
| Boleto | 3,317 | 22.93 |
| Voucher | 505 | 3.49 |
| Debit Card | 196 | 1.35 |
| North East | ||
| Credit Card | 7,381 | 76.47 |
| Boleto | 1,709 | 17.71 |
| Voucher | 423 | 4.38 |
| Debit Card | 139 | 1.44 |
| Center West | ||
| Credit Card | 4,382 | 74.27 |
| Boleto | 1,258 | 21.32 |
| Voucher | 204 | 3.46 |
| Debit Card | 56 | 0.95 |
| North | ||
| Credit Card | 1,369 | 72.36 |
| Boleto | 425 | 22.46 |
| Voucher | 71 | 3.75 |
| Debit Card | 27 | 1.43 |
Sellers
How many sellers are active on Olist, and how does this number change over time?
Active sellers
sellers |>
  summarise(number_of_sellers = n_distinct(seller_id)) |>

  clean_names() |>
  gt() |>
  fmt_integer() |>
  cols_align(align = "center") |>
  tab_style(style = cell_text(color = color_bold, weight = "bold"),
locations = cells_body())| Number Of Sellers |
|---|
| 3,095 |
orders |>
  left_join(select(order_items, order_id, seller_id), by = "order_id") |>
  left_join(sellers, by = "seller_id") |>
  distinct() |>

  mutate(order_date = date(order_purchase_timestamp),
         order_year = year(order_purchase_timestamp)) |>
  group_by(order_date, order_year) |>
  summarise(number_of_sellers = n_distinct(seller_id)) |>

  ggplot(aes(x = order_date, y = number_of_sellers)) +
  geom_line(color = color_line) +
  facet_wrap(vars(order_year), ncol = 1, scales = "free") +
  labs(x = "Date",
       y = "No. Sellers",
       title = "Number of Active Sellers on Olist") +
  theme_minimal() +
  theme(plot.title = element_text(color = color_title, size = 12),
        axis.title = element_text(color = color_axis_title, size = 9),
        axis.text.x = element_text(size = 8))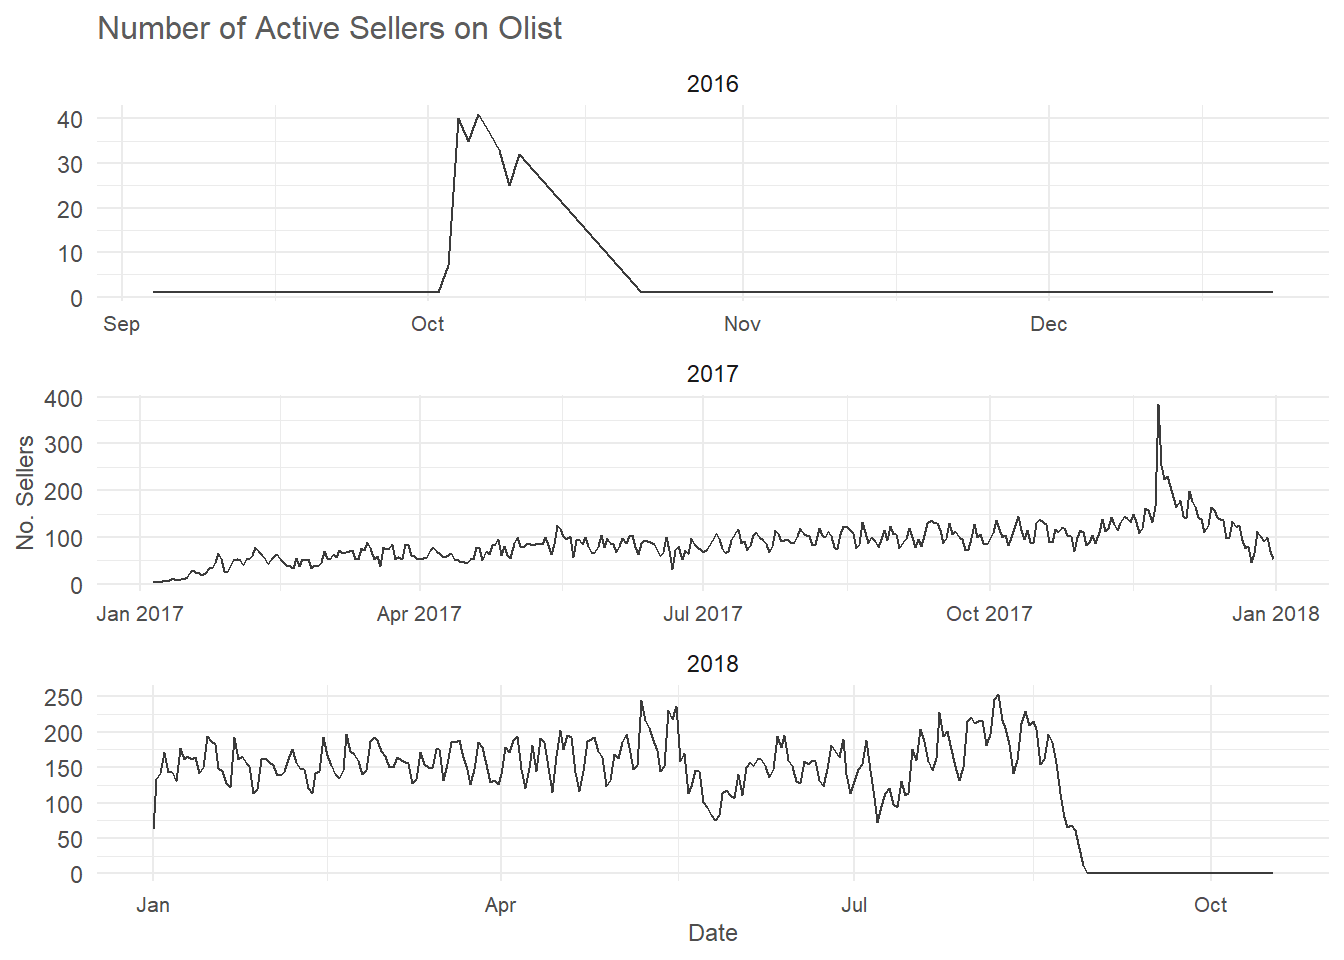
The trend chart of the number of active sellers on the Olist platform provides valuable insights into the growth and stability of the platform during the analysis period. The chart shows that there has been steady growth in the number of active sellers on the platform from 2016. The number of active sellers increased from 146 in 2016 to 1,785 in 2017, and then to 2,384 in 2018. This suggests that the platform has been successful in attracting more sellers to its platform over the years. The chart also reveals that the number of active sellers in 2018 saw more variability than in 2017, which is consistent with the patterns observed in the amount of order and revenue generated during the period.
What is the distribution of customer ratings on Olist, and how does this impact sales performance?
summary(reviews$review_score) |>
  as.list() |>
  as.data.frame() |>
  clean_names(c("Minimum", "1st Quarter", "Median", "Mean", "3rd Quarter", "Maximum")) |>
  gt() |>
  fmt_number(columns = Mean) |>
cols_align(align = "center") | Minimum | 1st Quarter | Median | Mean | 3rd Quarter | Maximum |
|---|---|---|---|---|---|
| 1 | 4 | 5 | 4.09 | 5 | 5 |
ggplot(reviews, aes(x = review_score)) +
  geom_boxplot() +
  labs(x = "Score", title = "Review Score Distribution") +
  theme_minimal() +
  theme(plot.title = element_text(color = color_title, size = 13),
        axis.title.x = element_text(color = color_axis_title),
        axis.text.y = element_blank())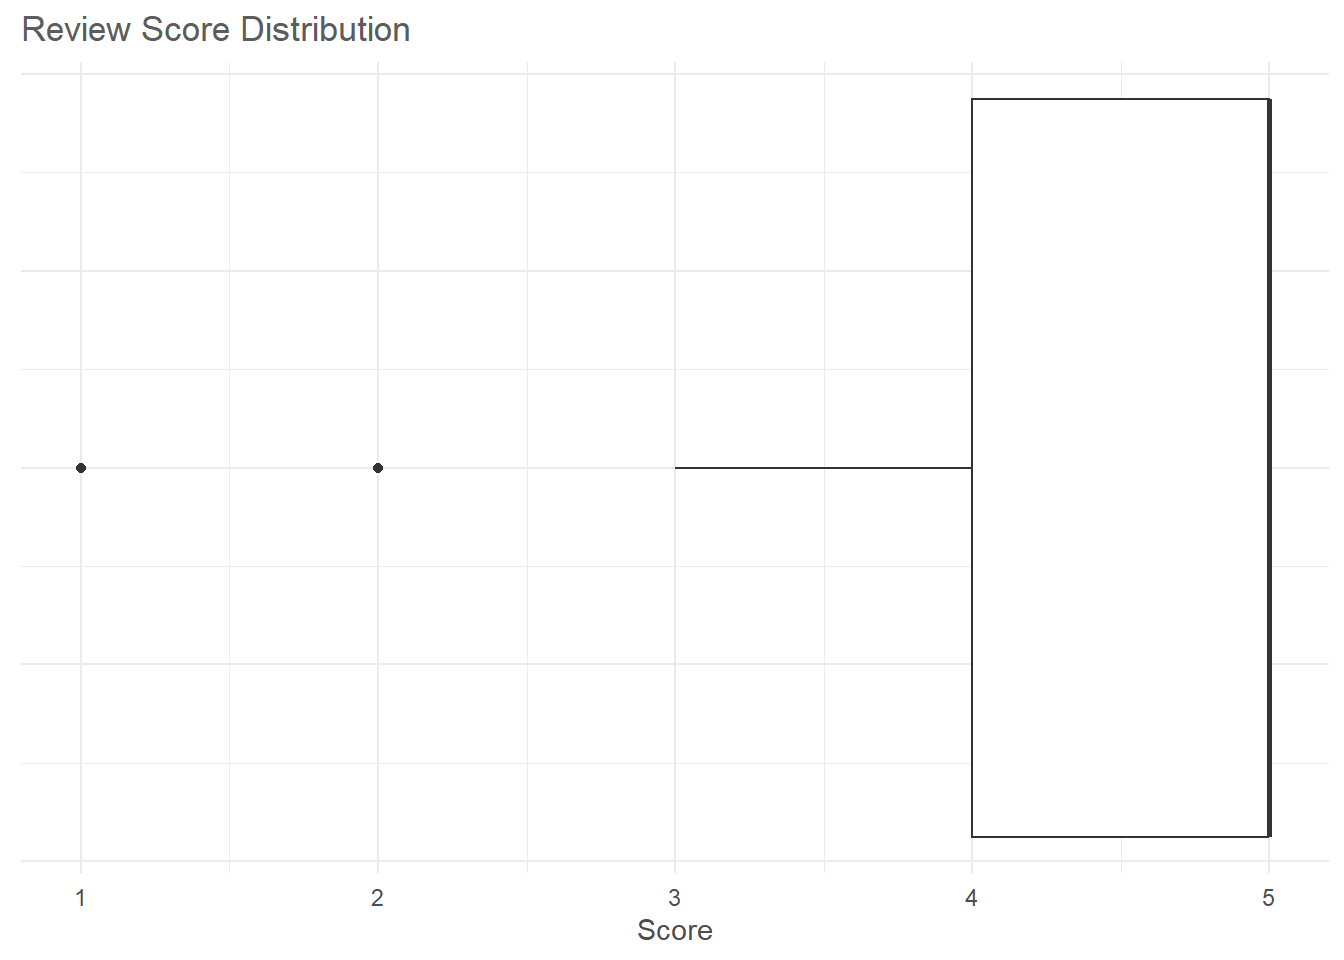
The satisfaction survey is an important tool for businesses to understand how their customers feel about their product or service. The distribution of the satisfaction survey given to customers in the above analysis indicates that a significant number of customers are satisfied with their purchase on the Olist platform. The rating system ranges from 1 to 5 with 5 being the best rating and 1 being the worst. The fact that 75% of customers gave a rating of 4 and above shows that the majority of customers were satisfied with the product and the overall transaction experience. This high satisfaction rating is a good indication that Olist is delivered value to its customers and was meeting their needs.
Sales performance
orders |>
  left_join(order_payment, by = "order_id") |>
  left_join(reviews, by = "order_id") |>

  group_by(review_score) |>

  summarise(count = n_distinct(customer_id),
            minimum = min(payment_value, na.rm = TRUE),
            median = median(payment_value, na.rm = TRUE),
            maximum = max(payment_value, na.rm = TRUE),
            total = unique_sum(payment_value)) |>
  arrange(desc(review_score)) |>

  clean_names() |>
  gt() |>
  fmt_number() |>
  fmt_integer(columns = c(`Review Score`, Count)) |>
  gt_fa_rating(`Review Score`, color = "#000000", icon = "star") |>
  tab_spanner(label = "Sales", columns = Minimum:Total) |>
  tab_style(style = cell_fill(color = color_highlight),
locations = cells_body(columns = Total))| Review Score | Count | Sales | |||
|---|---|---|---|---|---|
| Minimum | Median | Maximum | Total | ||
| 57,076 | 0.00 | 98.38 | 6,929.31 | 4,993,096.00 | |
| 19,098 | 0.00 | 97.81 | 4,764.34 | 2,129,572.17 | |
| 8,160 | 0.00 | 97.76 | 3,242.84 | 1,020,347.62 | |
| 3,148 | 0.17 | 104.85 | 3,360.66 | 499,268.00 | |
| 11,393 | 0.00 | 113.34 | 13,664.08 | 1,822,821.49 | |
| 768 | 0.14 | 110.12 | 6,922.21 | 144,678.03 | |
The sales summary by review score table provides an insightful view of how review scores affect sales. The table shows that orders with higher ratings score of 5 and 4 generated the most sales. This suggests that customers tend to purchase products with high ratings and are more likely to return for future purchases. Additionally, the data reveals that orders with a review score of 1 generated more sales on average and in total than orders with review scores of 2 and 3, even though there were more ratings of 1 than 2 and 3.
Customers
How many customers have made repeat purchases on Olist, and what percentage of total sales do they account for?
Number of returned customers
orders |>
  left_join(customers, by = "customer_id") |>

  group_by(customer_unique_id) |>
  summarise(count = n_distinct(order_id)) |>
  mutate(percentage = proportions(count)*100) |>
  arrange(desc(count)) |>
  filter(count > 1) |>
  summarise(total_customers = n_distinct(customer_unique_id),
            percentage_customer = sum(percentage)) |>

  clean_names(c("Total Customers", "Percentage of All Customers")) |>
  gt() |>
  cols_align("center") |>
  fmt_integer(columns = `Total Customers`) |>
  fmt_number(columns = `Percentage of All Customers`) |>
  tab_style(style = cell_text(color = color_bold, weight = "bold"),
location = cells_body(columns = `Percentage of All Customers`))| Total Customers | Percentage of All Customers |
|---|---|
| 2,997 | 6.38 |
The table shows that there was a low percentage of repeated purchasers on Olist, with just 6.38% of all customers making more than one order. This could be due to several factors, including the nature of the products being sold, the competitiveness of the market, or the quality of customer service provided by the sellers.
Percentage of total sales
orders |>
  left_join(customers, by = "customer_id") |>
  left_join(order_payment, by = "order_id") |>

  filter(!order_status %in% c("canceled", "unavailable")) |>
  group_by(customer_unique_id) |>
  summarise(number_of_orders = n_distinct(order_id),
            total_sales = sum(payment_value, na.rm = TRUE)) |>
  mutate(percentage = (total_sales / sum(total_sales))*100 ) |>
  filter(number_of_orders > 1) |>
  summarise(total_sales = sum(total_sales),
            total_percentage = sum(percentage, na.rm = TRUE)) |>

  clean_names(c("Total Sales", "Percentage of Total Sales")) |>
  gt() |>
  fmt_number() |>
  cols_align("center") |>
  tab_style(style = cell_text(color = color_bold, weight = "bold"),
location = cells_body(columns = `Percentage of Total Sales`))| Total Sales | Percentage of Total Sales |
|---|---|
| 890,534.12 | 5.66 |
The sales data on Olist platform reveals that a vast majority of the sales, about 94.34%, came from customers who made their first purchase. This suggests that Olist should focused on increasing the number of first-time customers to drive sales growth. However, the fact that repeated customers account for only 5.66% of the total sales also highlights the importance of retaining customers. While acquiring new customers is crucial, retaining existing customers can be even more important for building a loyal customer base that generates repeat sales over time.
What is the average customer rating for products sold on Olist
orders |>
  left_join(reviews, by = "order_id") |>
  left_join(order_items, by = "order_id") |>
  left_join(products, by = "product_id") |>

  group_by(product_id) |>
  summarise(avg_rating = median(review_score, na.rm = TRUE)) |>

  ggplot(aes(x = avg_rating)) +
  geom_bar(color = "white") +
  labs(x = "Rating",
       y = "Count",
       title = "Distribution of Median Rating Score by Product") +
  scale_y_continuous(labels = scales::comma_format()) +
  theme_minimal() +
  theme(plot.title = element_text(color = color_title, size = 12),
        axis.title = element_text(color = color_axis_title))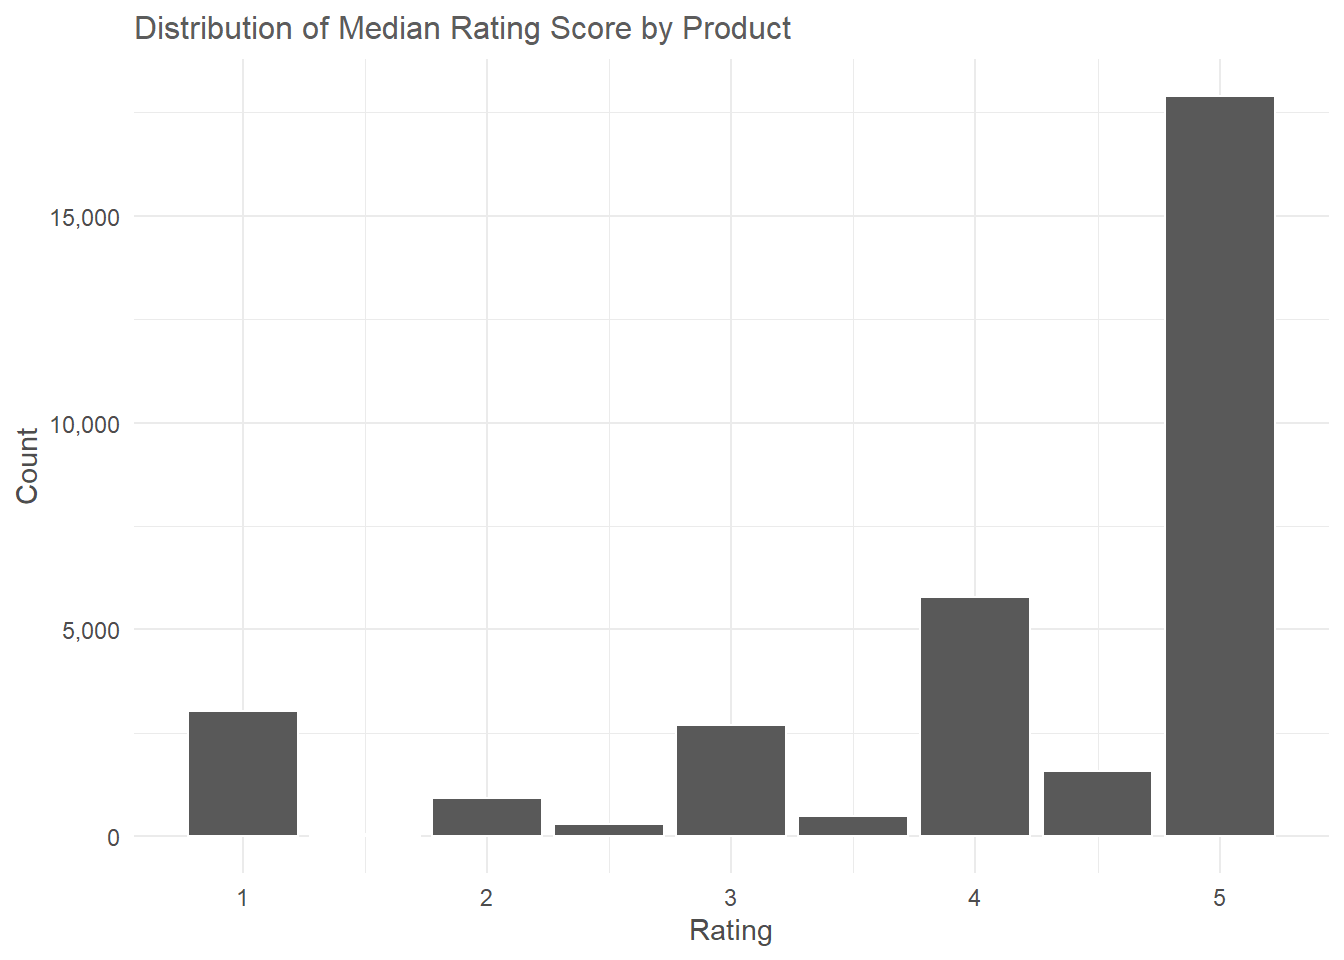
The analysis of the products by review score chart indicates that the majority of products on Olist have high ratings, with over 15,000 products having a perfect rating score of 5. This was a positive sign for both Olist and its seller as it suggests that the majority of products sold on the platform are of good quality and meet the expectations of customers. Additionally, there were very few products with a low rating score of 2, which is a positive sign as well, as it indicates that customers are not frequently receiving poor-quality products.
Insights
The historical analysis of orders on the Olist platform between June 2016 and October 2018 revealed interesting patterns. 1. The analysis shows a steady increase in the total number of orders in 2017 except for some months such as April, June and December when orders declined. In contrast, 2018, which had more orders on average, saw a steep decline across several months, starting from April down to September, and the biggest decline happened from August to September, where there was a 6,496 difference in order, which means that September only had 16 orders in total.
The total order across each year showed a seasonality trend, with 2017 having a peaked period that lasted for a short period from 2017-11-23 to 2017-11-29, with the highest being on 2017-11-24.
The majority of customers used credit card payment option to process their order, about 73.92% of orders, with debit card being used in just 1.47% of the total orders. Across all product categories, the preference for payment method remains the same, with credit card taking the first choice, followed by Boleto, voucher, and debit card.
Looking at the Olist platform active sellers trend chart, the overall total number of sellers was 3,095. The number of active sellers on Olist in 2017 saw less variability than in 2018, which closely relates to the patterns in the amount of order and revenue generated during those periods. In 2016 there were 146 active sellers, in 2017, 1,785 and 2018, 2,384.
The satisfaction survey results indicate that 75% of customers gave a rating of 4 and above, indicating a high level of satisfaction with the transaction process. According to the sales summary by review score table, orders with higher ratings score (5, 4) generated more sales than those with low ratings, except for those with 1 rating score, which generated more sales on average and in total than orders with 2 and 3 rating scores. It is also worth noting that there were more rating scores of 1 than 2 and 3.
About 93.6% of sales on Olist were from customers making their first purchase, and only 5.66% of the total sales were generated by repeated customers.