Host Space Exploratory Analysis.
Since Airbnb lunched their platform, many property owners have had the opportunity to rent out space in their property to travelers seeking lodging in exchange for a price. Of recent many people around the world have joined the trend in listing properties they own on the platform and earning sustainable income. Another benefit of the platform is how it has made it easy to get started in the hospitality industry at a low cost and without worrying about the various logistics that comes with running a full lodging company, it also benefit guests in such a way unlike normal hotels, if made available by the host, they get to enjoy more home like amenities and experience. Providing such service can be challenging and will require alot of planning and preparation to meet certain standard and to also make sure the reservation is a direct reflection of what was advertised. Here i will explore the strategies of hosts and how they are able to meet some of the important basic requirements such as property cleanliness, provision of essential home amenities, good communication and the overall comfortability of their guests. It is important to note that the data focus on reservations in Boston, USA. it will be interesting to examine the role of the host location and how it impact guest interest and decision. Also we will be looking at the various price structure, property types, host listing periods and other important insights.
Number of hosts:
Out of 43,123 unique guest reviews, there are 1,403 unique hosts within the current data period.
Count based on host location.
The top 10 locations are residence to 69.4% of all host, while Jamaica Plain have the most number of host e.i 11%, other top locations have an almost equal share.
Reservation price distribution
Looking at the price per night, it appears that about 75% of reservation price falls between $185 and below. In addition the average booking price using the unfiltered data is $145.5
Just like the per night price distribution, majority charge lower prices for their service than high charges given that about 75% of host charge $1,140 or below for a whole week. while there is a minimum amount of $200 there is also a massive difference when we look at the maximum price of $4,200. Additionally from the weekly distribution plot there are about 1,181 hosts that charge between $900 to $919 which is the most used weekly charges.
Using the unfilterd data, there is a big difference between the minimum ($650) and maximum ($15,000) monthly price by hosts. Also from the plot, 75% charge $3,990 and below.
Lodging price by location.
Before looking at the median value of various locations, it is important to note that there are locations with very few hosts which influence the median price to have a higher value than locations with more hosts where the price are more distributed.
Property listing period:
Given the number of period a host have been listed on airbnb, are longer period associated with higher price, lower price or are the prices just random. If we are to use years of hosting experience as a factor that affect cost of creating such service.
Number of period beign a host.
The number of periods after listing a property can also be seen as the number of periods on service experience and infomation about running a successful hosting service with minimum costs can be gained, so looking at the distribution summary for the number of days after listing, majority e.i 75% have been listed for more than 2 years or close to 3 years. furthermore, the general average period for all host is less than 2 years if the outliers of longer periods are put into consideration. so we can say that a majority of host are very much are working towards their second year.
Periods & price structure
| host_since_days | |
|---|---|
| host_since_days | 1.000 |
| price | -0.001 |
| weekly_price | 0.020 |
| monthly_price | -0.008 |
There is not an obvious relationship between the number of days after listing a property and the price structure of the booking the property, investigating further might suggest reason such as competition driving price, guest affordability, state/industry price benchmark and so on.
Extra guest and extra charges:
The added cost and provisions involved in having extra guests for a reservation.
Number of accommodated guest
When we look at the number of guests that can be comfortable accommodated without forgoing the quality of their experience, the aggregated average indicate that about 48% of hosts can comfortably host just two guest while 90% of hosts are willing to accommodate from 1 to 4 guests.
Minimum number of nights reservation.
For the minimum number of nights guest choose to spend, 49% of guests opt for a minimum of 1 night while 91% made a decision to spend from 1 night to 3 nights.
more guests more reservation cost?
There is a steady increase in the average price charged for reservation as the number of accommodated persons increases with some exception such as host accommodating as much as 9 guests.
Property type, host location and price summary:
Expensive locations.
Given that there are locations with very small number of host e.i less than 4 hosts, for this analysis only locations with a minimum of 5 host will be included.
Looking at the top 10 highest median reservation cost, Downtown Crossing in Boston, Cambridge, Boston, West End, Boston top the chart and given that all three locations have less number of host compare to other locations, one of the reasons for such high price can be lack of competitions from other “airbnb” service providers.
The highest weekly median reservation charge was from cambridge, Boston, it cost roughly 1,733 more for a weekly reservation than other locations.
Just like per night prices of reservation, median monthly cost of booking an accommodation is much higher in Downtown Crossing, Boston where the median is 9,500 and Cambridge, Boston costing 7,200.
Extra deposit for security measures cost more in West Roxbury, Boston, Chinatown, Boston & Charlestown, Boston $200 more than other locations.
The median charges for cleaning services is higher in Cambridge, Boston as it cost $19 more than other locations.
Overall reservation cost are more expensive in locations such as Downtown Crossing, cambridge and Chinatown while extra charges on security and sanitation cost more in cambridge. furthermore it is also important to note that the number of hosts present in the above listed locations are quite few compared to other locations.
Property type and reservation cost:
The type of property is one of the major features guests look out for when making a decision as it impact certain amount of comfortability and also the cost of making a reservation. We will look at the most common property and also the cost associated with it.
Property type count
| Property Type | Count | Proportion | |
|---|---|---|---|
| 0 | Apartment | 1091 | 74.88 |
| 1 | House | 236 | 16.20 |
| 2 | Condominium | 57 | 3.91 |
| 3 | Loft | 24 | 1.65 |
| 4 | Bed & Breakfast | 24 | 1.65 |
| 5 | Townhouse | 9 | 0.62 |
| 6 | Boat | 6 | 0.41 |
| 7 | Other | 3 | 0.21 |
| 8 | Dorm | 3 | 0.21 |
| 9 | Cabin | 2 | 0.14 |
| 10 | Castle | 1 | 0.07 |
| 11 | Villa | 1 | 0.07 |
The must common property listed by host is Apartment which make up 78.9% of all types property. while the least used property are Castle and villa.
Property price summary
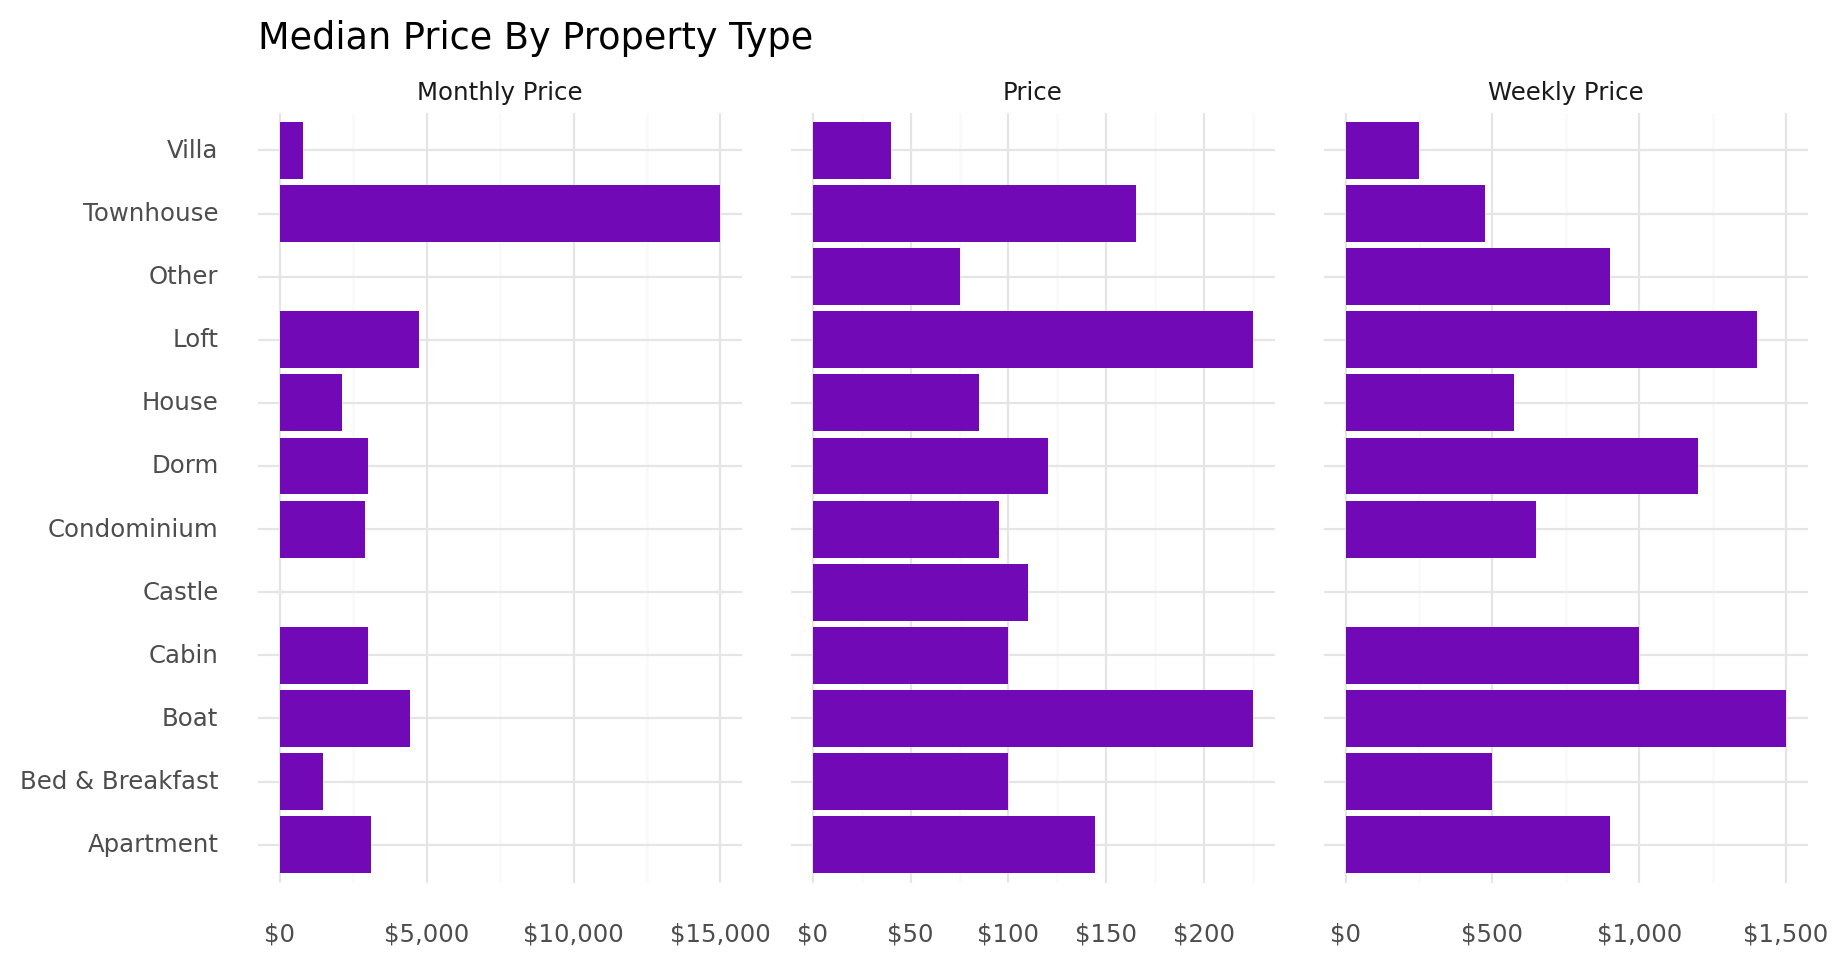
<ggplot: (149753488372)>Both Loft and Boat have the highest median cost for price per night and weekly price, Importantly Townhouse cost more on a monthly bases than other types of property.
Property features:
Room type
About 2.42% of hosts offered a shared room, while majority (i.e 56.8%) put out the entire apartment.
Number of bathroom, beds and price correlation
There is a moderate correlation between the median number of beds a property have and the cost of booking such property. This indicate that to some extent, when there are more rooms in a property is more, there are tendencies that there will be a higher cost of booking such property, in addition the number of bathrooms in a property have a low correlation with the price of the apartment.
Instant booking acceptance:
By location.
Host in East Boston, Boston have a higher percentage (27.27%) of bookings that where instantly accepted the same can be said for hosts in Roxbury, Boston and Dorchester, Boston than other locations.
Essential amenities:
Some the most popular or important amenities offered by hosts relating to security, communication, social event, etc and how it relationship with price structure.
Pertaining to guest Safety, 81.11% of hosts property contains Some Detectors while 45.32% have Fire Extinguishers in the event of a fire outbreak, just 33.65% have a First Aid Kit.
Regarding the availability of Comms, 95.03% of hosts property have Wireless internet, while 78.02% also included some sort of internet. In addition 70.91% have a TV installed and just 51.86% have a Cable TV.
For other important amenities, the analysis reveal that 94.14% of bookings have a Heating system, while 77.50% have an Air Conditioning system in place. For the Essentials 76.35% have them while just 5.39% have a Hot Tub in them.
Just 43.38% of all booking are Family/Kid Friendly while just 4.55% can be used for Events.