As customer retention proves to be a significant advantage for the coffee house, a direct inquiry into respondents' future intentions and their relationship with the coffee house was conducted. The findings indicate that 77% of respondents expressed their commitment to continuing future purchases, highlighting a positive position for maintaining existing customer relationships. Though, it is noteworthy that 23% stated their intention not to continue making future purchases. Exploring the reasons behind this decision could provide valuable insights, enabling the coffee house to make informed adjustments and prevent further customer attrition to competitors.
Satisfaction & Retention
To measure the customer retention rate, we asked the respondents whether they would continue to patronize Coffee House in the future.
77% Retention
23% Churn
Visit frequency
To measure the customer level of engagement, we asked the respondents how often they visit the coffee house.
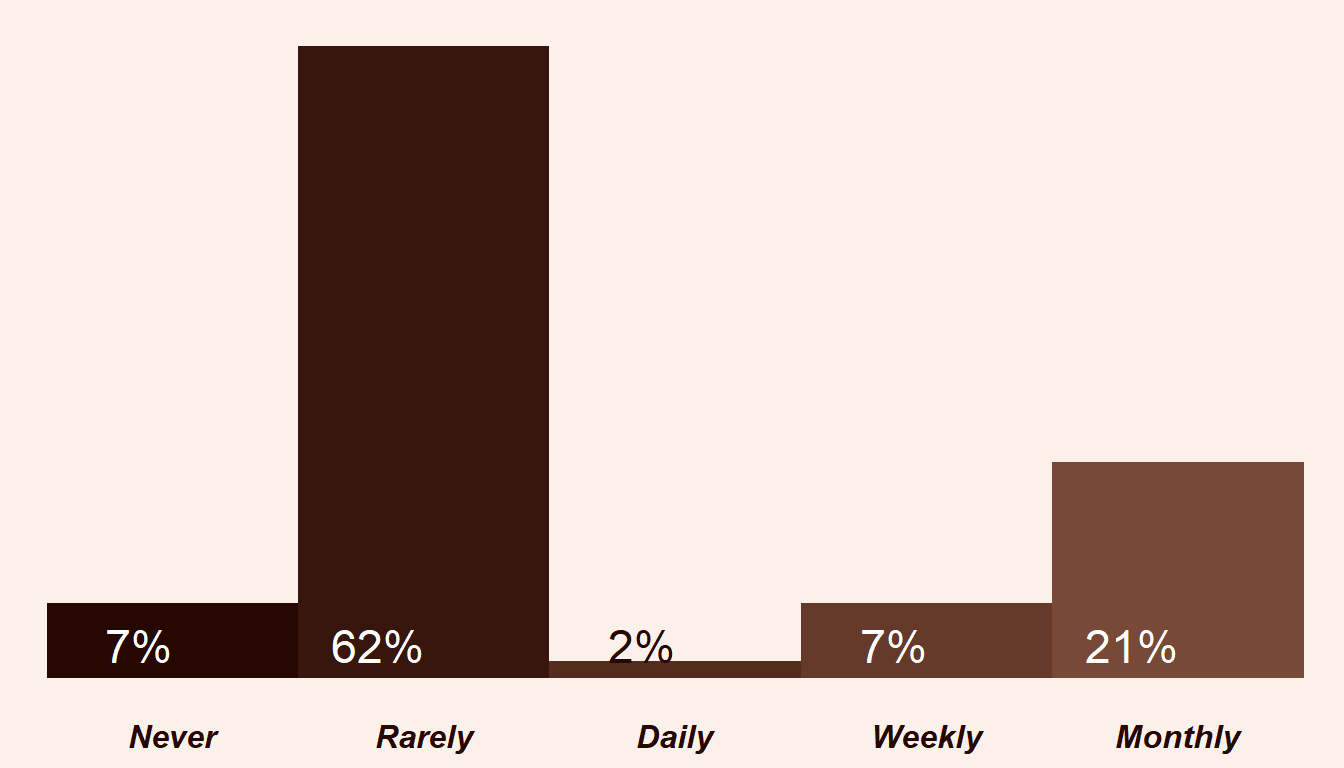
The coffee house visitation patterns among respondents indicate that a significant majority, specifically 62%, rarely visit Coffee House. When examining more specific time frames, 21% report a monthly visitation frequency. Daily visitors constitute a minimal 2%, and those who visit on a weekly basis make up 7% of the total respondent pool.
The fact that a majority (62%) of respondents rarely visit the coffee house indicates a lower level of engagement or loyalty among a significant portion of the customer base. In terms of customer retention, this could pose a risk as infrequent visits may lead to a weaker connection between the customers and the coffee house.
Delivery option
To understand how customers prefer to make their order when they visit the outlet, we asked the respondents how do they make purchase at the coffee house.
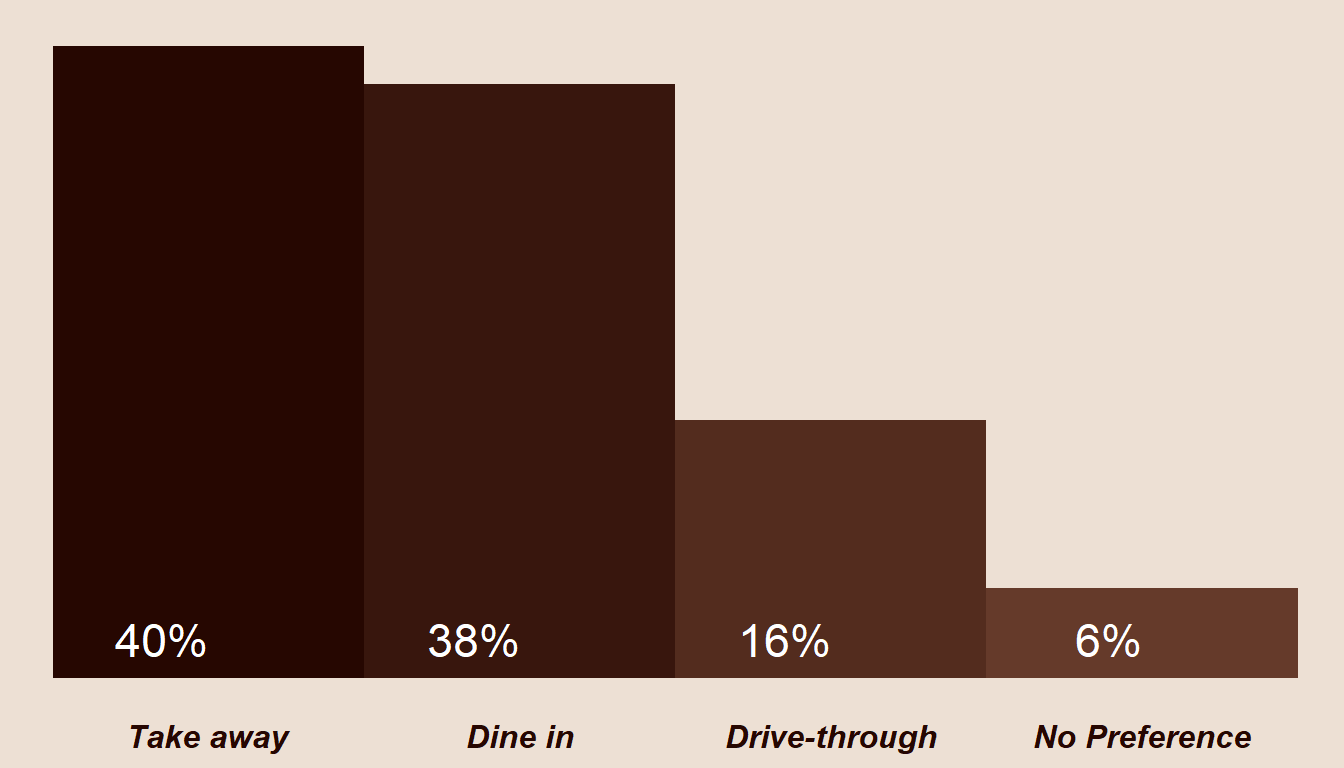
40% of respondents indicated a preference for take-away, emphasizing a desire for quick service. Close behind, 38% expressed a preference for dining in, indicating a willingness to linger, particularly during events such as meetings. Drive-through service, known for its convenience, was favored by 16% of respondents. Notably, 6% of participants did not express a specific preference for any particular ordering method.
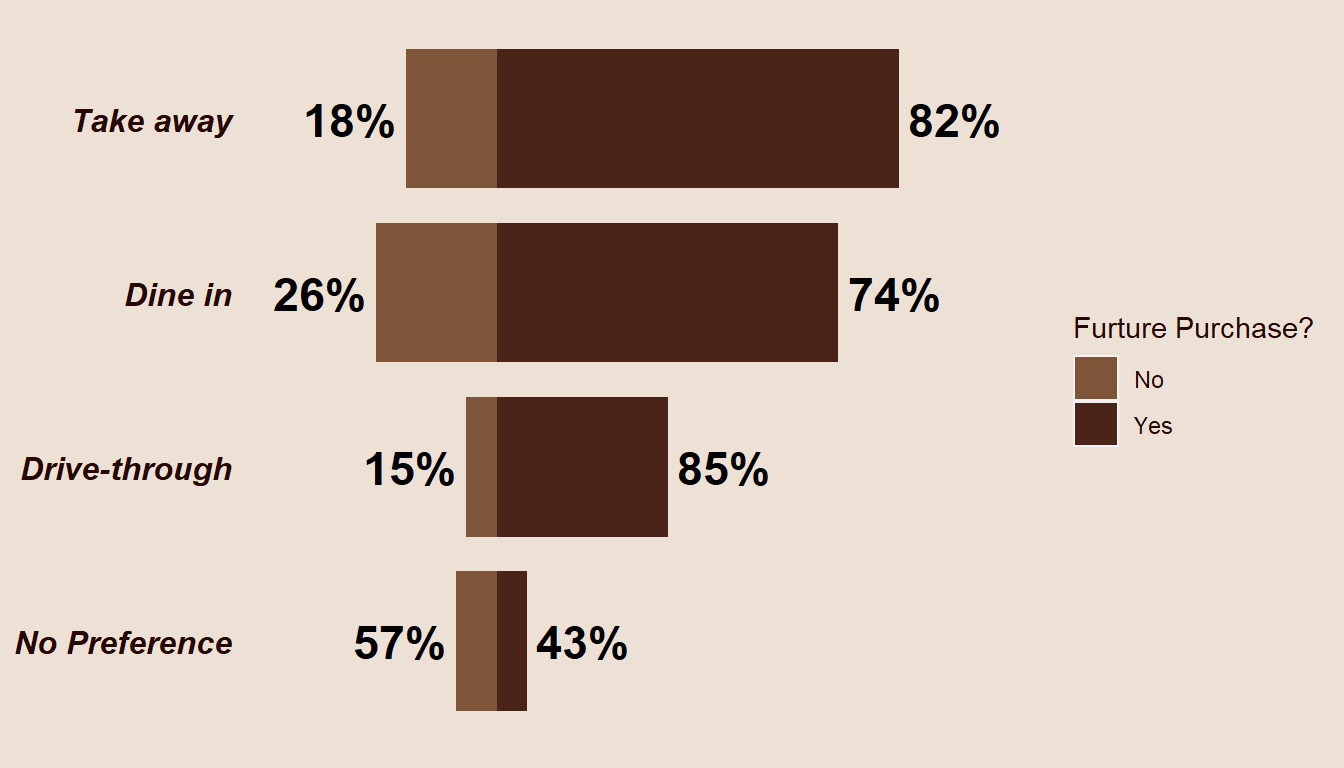
A significant majority of respondents in the take-away, dine-in, and drive-through categories, averaging 80% in each group, expressed an intention to continue making future purchases. On the other hand, for those respondents indicating 'No preference' for a specific purchase method, more than 55% conveyed that they would not make future purchases. This finding highlight a possible challenge in retaining customers without a preferred purchase method, indicating a lower level of engagement or understandings of the available options.
Membership
To access customers level of loyalty, we asked them if they are members of Coffee House.
The distinction between members and non-members of the coffee house is relatively narrow, with 51% of respondents indicating that they are not members, while 49% stated that they hold membership.
49%
Member
51%
non-Member
How members heard about coffee house.
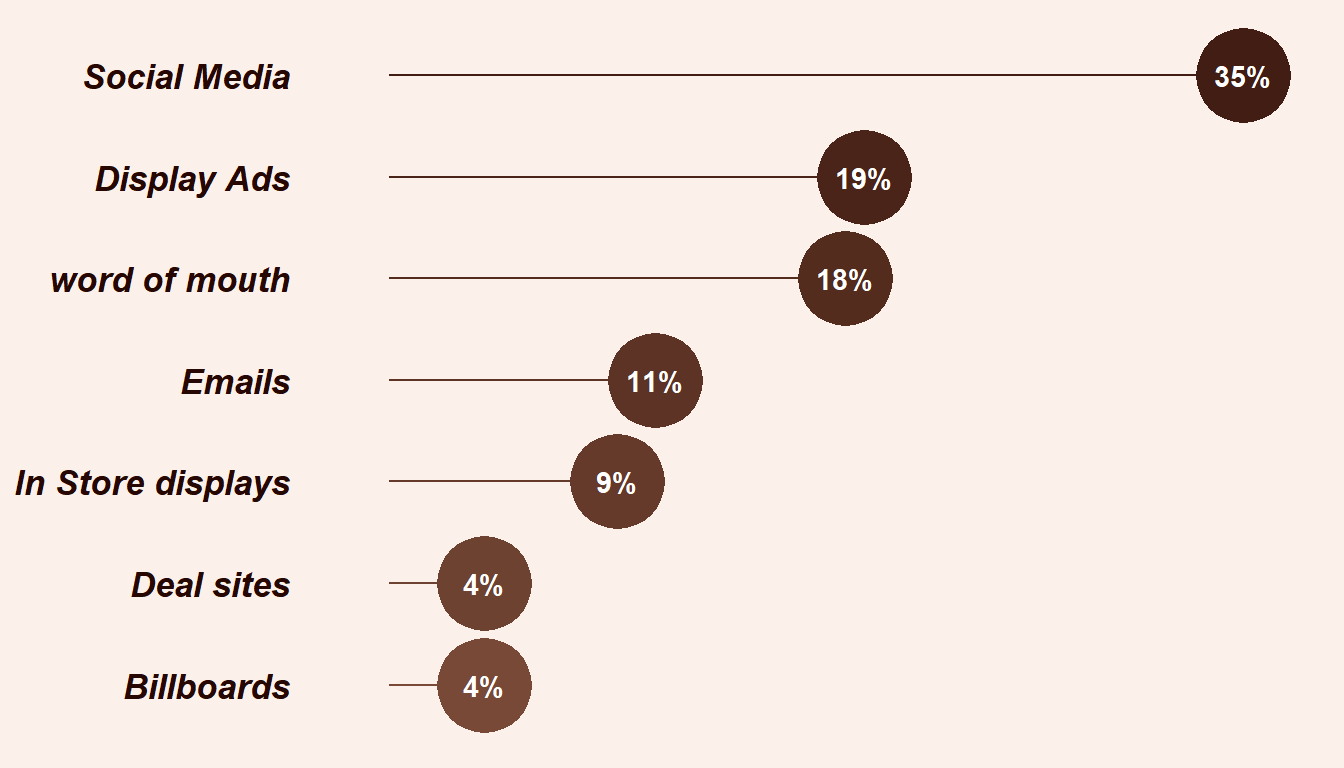
The primary means through which members became aware of Coffee House was via 'Social Media,' with a significant 35% of respondents citing this platform. Following closely, 19% mentioned discovering the outlet through the 'Display advertising.' 'Word of mouth' played a substantial role as well, accounting for 18% of total responses. Other mediums, including 'Emails' and 'In-store display,' contributed to awareness, while 'Deals site & billboards' represented the least common channels, comprising only 8% in combination.
Membership & age group distribution.
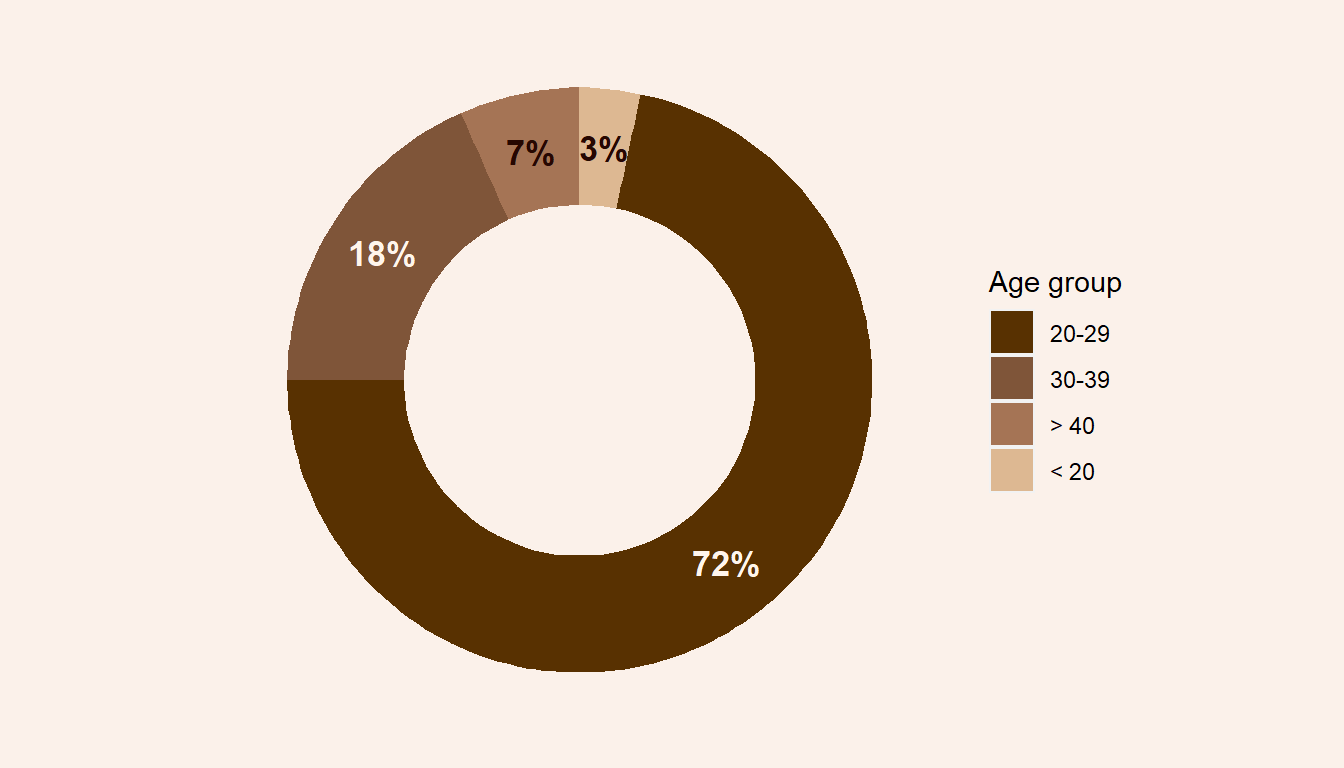
When examining membership in correlation with age groups, a substantial majority, comprising 72% of members, falls within the 20 to 29 age range. Another 18% are aged between 30 and 39. Comparatively, only a small percentage falls below the age of 20 or above the age of 40. In summary, it is evident that the coffee house's most loyal customers are predominantly within the age range of 20 to 39 years.
Membership & Possible Future Purchase
45%
Member
Possible Retention
4%
Member
Possible Churn
19%
non-Member
Possible Churn
32%
non-Member
Possible Retention
Upon inpecting the responses regarding possible future purchases by members and non-members of the coffee house, it is evident that 45% of the total respondents who are members expressed an intention to continue making future purchases. In contrast, 32% of non-members shared a similar sentiment. Additionally, 4% of members conveyed that they would not be making any future purchases, while 19% of non-members expressed the same intention. These findings highlight varying attitudes toward future patronage, with a higher percentage of members expressing a positive standpoint for continued engagement.
Number of frequently purchased products
To measure the number of orders made frequently and how it affect customer future stance, we asked customer their most frequent order.
| Orders | Future Purchase? | Respondent |
|---|---|---|
| 1 | No | 23% |
| 1 | Yes | 77% |
| 2 | No | 12% |
| 2 | Yes | 88% |
| 3 | Yes | 100% |
| 4 | Yes | 100% |
| 5 | Yes | 100% |
The data indicates a positive correlation between the frequency of orders and the likelihood of making future purchases. Notably, 100% of respondents making 3 to 5 frequent orders expressed their intent to continue making future purchases. Similarly, 88% of respondents with 2 frequent orders plan to make future purchases. In contrast, 77% of those with 1 frequent order indicated their intention to make future purchases. This pattern suggests that as the number of frequent orders increases, so does the propensity for customers to continue engaging with the coffee house in the future.
Promotion
To understand how customers became aware of Coffee House, we asked customer how they came to hear our promotions.
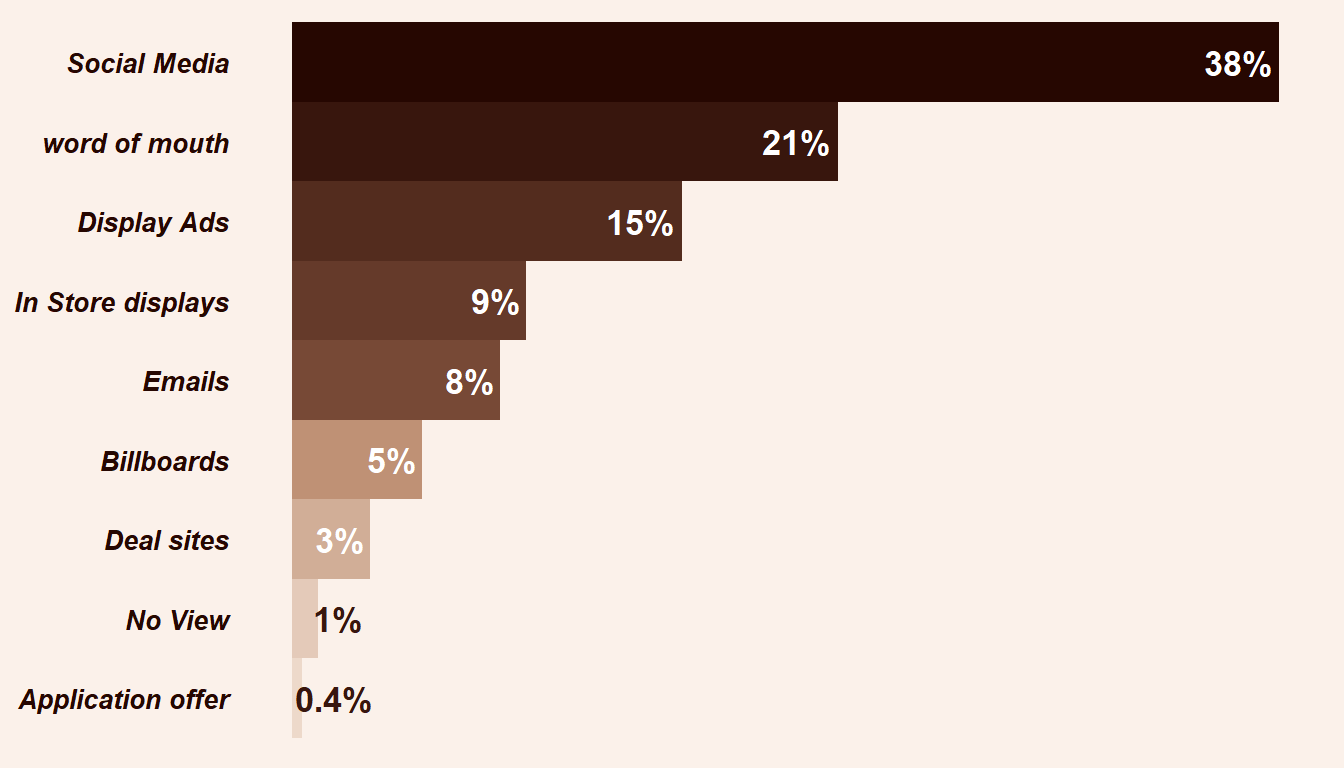
Awareness of the coffee house through advertising and promotions reveals that 38% of respondents learned about it through social media, emphasizing the impact of online platforms. Word of mouth played a significant role, with 21% of respondents acquiring information through recommendations. Additionally, 15% mentioned discovering the coffee house through display advertising, while 9% cited in-store displays. The remaining 17% is distributed among various channels, including emails, billboards, deal sites, and application offers, demonstrating a diverse range of sources contributing to customer awareness.
Average spend
To measure the expected amount customers would spend per visit, we asked them on average, how much they would spend at Coffee House per visit.
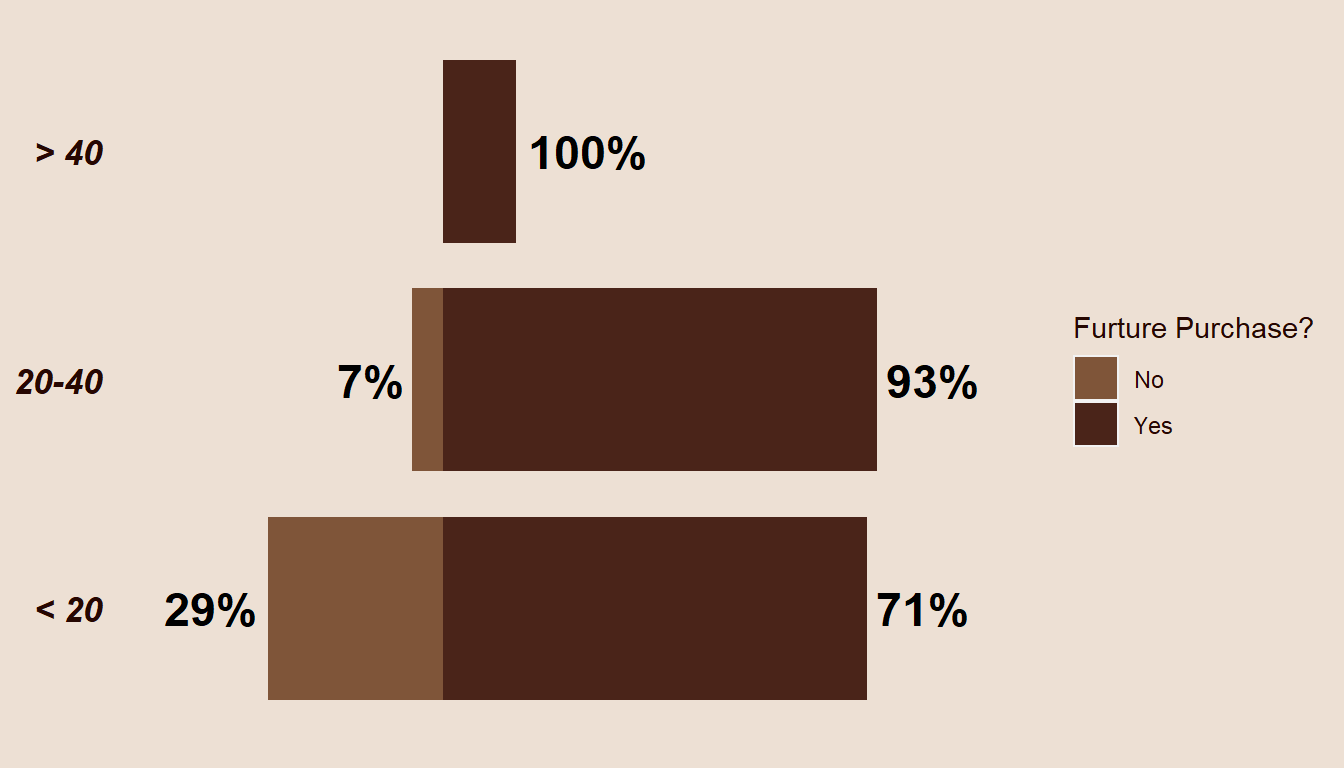
Examining the relationship between customer average spend and future purchases reveals interesting patterns. Of the respondents who indicated they would spend more than RM40 on average (6% of the total), all expressed their intention to continue making future purchases. Additionally, 37% of respondents planning to spend between RM20 and RM40 conveyed a high intent for future purchases, with 93% expressing their commitment. For those intending to spend below RM20, a substantial 71% stated their intent to continue purchasing in the future. This observation suggests a possible positive correlation between customer willingness to spend and their likelihood of remaining active and engaged in the future.
Key Observation
- Majority of respondents rarely visit Coffee House which poses a challenge for customer retention and loyalty.
- When making orders at coffee House, 40% prefer take-away, 38% prefer dine-in, and 16% prefer drive-through, which reflect a balance between quick and moderate services.
- The respondents are almost evenly split between members and non-members of Coffee House, with 49% and 51% respectively. This raises the issue of customer loyalty and how to increase it.
- A higher frequency of orders correlates with a higher likelihood of future purchases.
- Respondents that are willing to spend more are more likely to make future purchases.